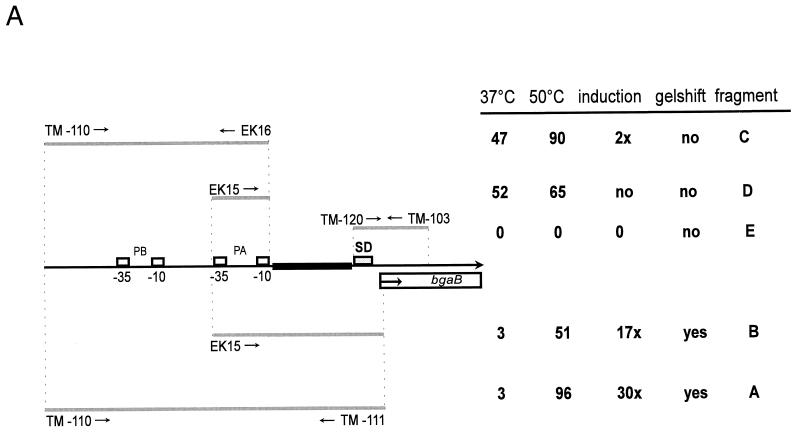
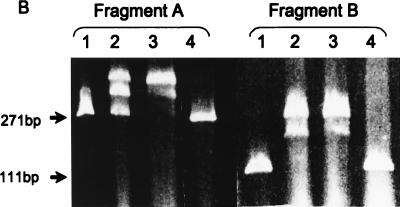
FIG. 5.
(A) Schematic representation of the 5′ upstream region of the clpC operon including simplified maps of ctsR′-bgaB fusions or fragments used in gel mobility shift experiments. The −10 and −35 boxes of the ςB-dependent promoter (PB), the ςA-dependent promoter (PA), the PCR primers (arrows), the Shine-Dalgarno region (SD), and the bgaB reporter gene are indicated. DNA fragments either fused to the bgaB reporter gene or used in gel mobility shift experiments are represented by gray lines, and a possible target region for the repressor is in bold and black. The corresponding results of the BgaB assays before (37°C) and after heat shock at 50°C, induction of expression, and behavior in gel mobility shift experiments are shown. (B) Gel mobility shift experiments with fragments A and B. Gel retardation experiments were performed as described in Materials and Methods. Fragment length (A, 271 bp; B, 111 bp) is indicated on the left. The lanes were loaded as follows: 1, free fragment; 2 and 3, fragments incubated with 0.05 and 0.1 nM purified CtsR protein; 4, fragment incubated with bovine serum albumin. (C) Gel mobility shift experiments with fragments C and E. Fragment length (C, 220 bp; E, 268 bp) is indicated on the left. The lanes were loaded as described above.


