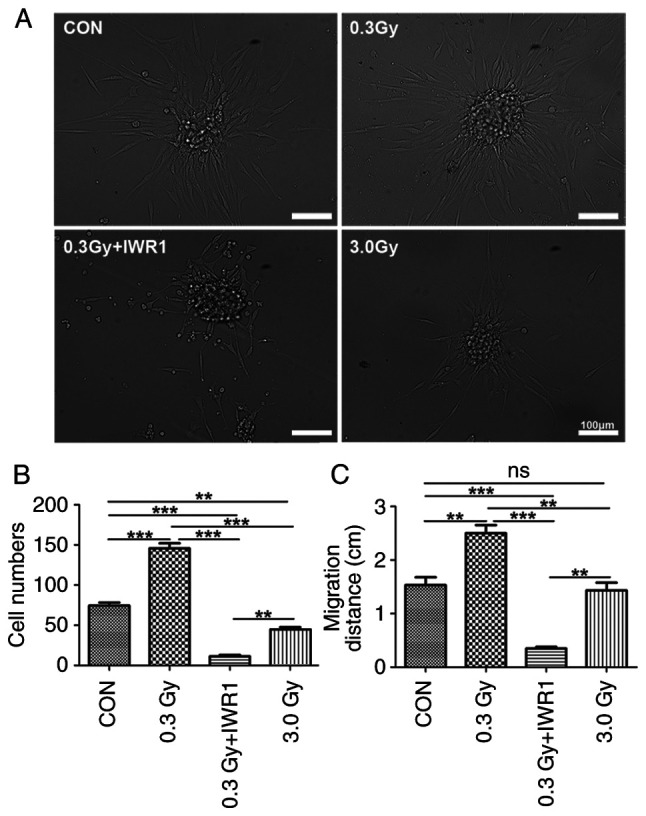
Figure 2.

Morphological and quantitative changes in proliferating and migratory C6 GSCs. (A) The morphological changes of C6 GSCs in each group under inverted phase contrast microscopy. (B) The statistical data of cell numbers of single clonal spheres are shown in each group. (C) The statistical data of the migration distances of C6 GSCs are shown in each group. Scale bar, 100 µm. **P<0.01 and ***P<0.001. GSCs, glioma stem cells; ns, no significance.
