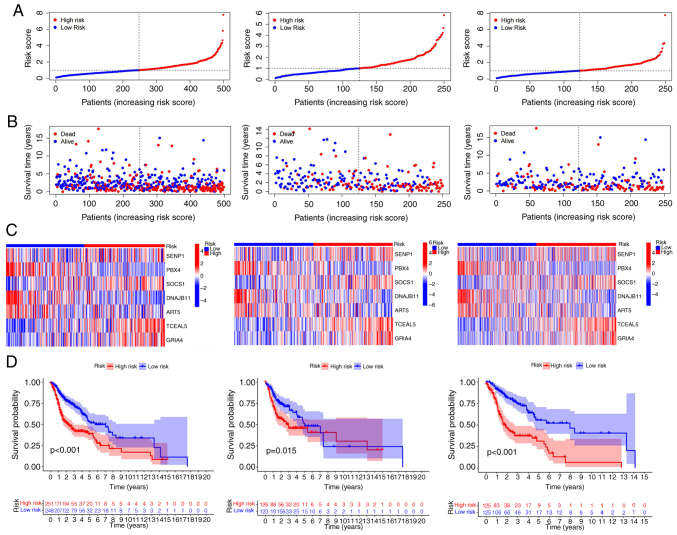
Figure 3.
Prognostic performance of 7 ferroptosis-related mRNAs in train group, test group and all groups. (A) Display of ferroptosis-related mRNAs prognostic models in train, test and all groups of risk score. (B) State diagram of survival risk in train group, test and all groups. (C) Heat map of ferroptosis-related mRNAs expression levels in high and low risk groups with high expression in red, low expression in blue. (D) Overall survival between high and low risk groups in the train group, test group and all group. All P<0.05.

