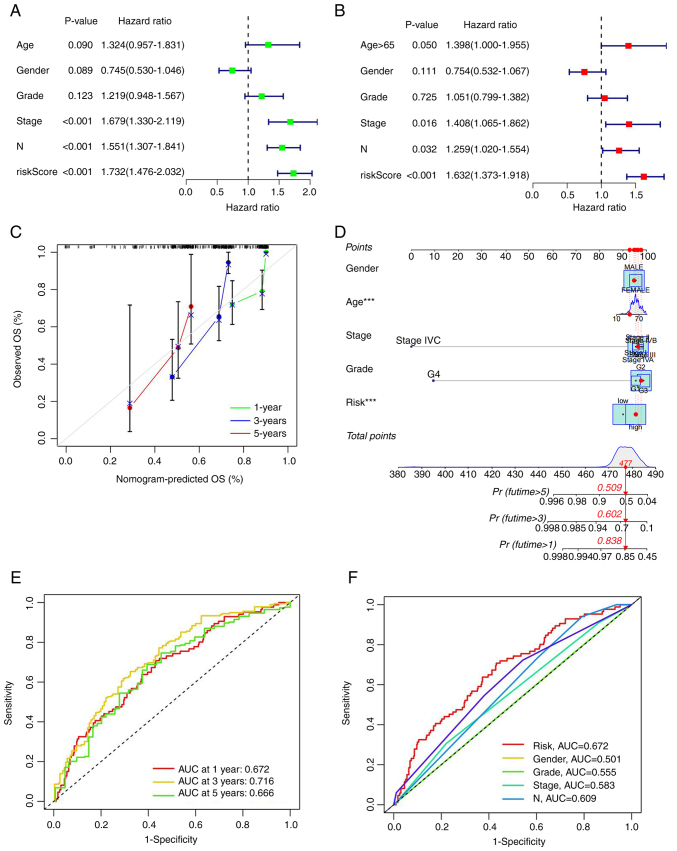
Figure 4.
Independent prognostic analysis and nomogram plotting. (A) Univariate Cox analysis of clinical traits. (B) Multivariate Cox analysis of clinical traits. (C) Combined risk scores, nomograms of clinical traits anticipate the 5-, 3- and 1-year survival in patients with head and neck squamous cell carcinoma. (D) Calibration curves for nomogram predicting survival. (E) ROC curves of all groups at 5 years, 3 years and 1 year. (F) Comparison of ROC curves of risk groups and clinical traits. ROC, receiver operation curve; AUC, area under the curve; OS, overall survival.

