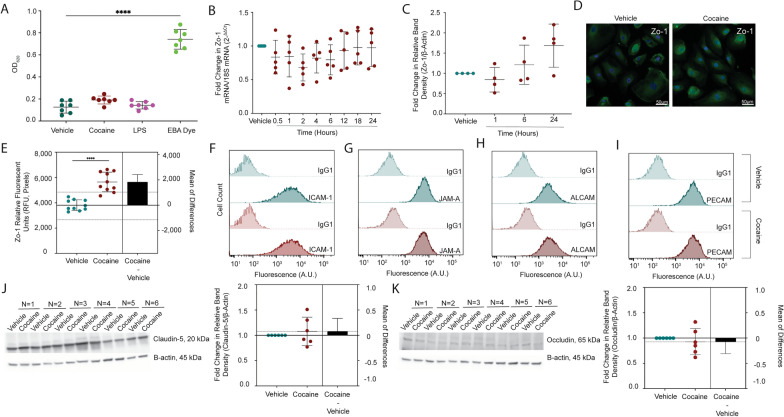
Fig. 3.
Cocaine Does Not Disrupt BBB Integrity. A BBB models were treated with cocaine (10 μM, burgundy), LPS (10 ng/mL, fuchsia), or vehicle (teal) for 24 h, after which time permeability to EBA dye was performed. EBA was added to the apical portion of the BBB for 30 min at 37 °C, 5% CO2, the media in the bottom collected, and evaluated spectrophotometrically at OD620. EBA dye alone (green) was used as a positive control to represent maximal BBB permeability. Seven individual experiments were performed (represented by individual dots). Data are represented as mean ± standard deviation. ****p < 0.0001. One-way ANOVA was performed. B qRT-PCR was performed to evaluate Zo-1 mRNA following 0.5–24 h treatment with cocaine (10 μM. burgundy). The 2-ΔΔCt method was performed to evaluate fold change in Zo-1 mRNA relative to 18S mRNA where vehicle treatment (teal) was set to 1. Five individual experiments were performed (represented by individual dots). Data are represented as mean ± standard deviation. C Western blot was performed to evaluate Zo-1 total protein expression following 1, 6, and 24 h treatment with cocaine (10 μM, burgundy). Blots were stripped and reprobed to evaluate β-actin for protein normalization. The fold change in relative band intensity for Zo-1/β-actin was determined by densitometry where vehicle treatment (teal) was set to 1. Four individual experiments were performed (represented by individual dots). Data are represented as mean ± standard deviation. D Immunofluorescent microscopy was performed to evaluate Zo-1 (green) following treatment with cocaine (10 μM, right) or vehicle (left) for 24 h. DAPI was used to visualize nucleus (blue). One paired representative image, out of 10 individual images, are shown. All scale bars = 50 μm. (E) Quantification of the fluorescent signal from Zo-1 immunofluorescent microscopy was performed for endothelial cells treated with cocaine (10 μM, burgundy) or vehicle (teal) for 24 h. Ten independent experiments (represented by individual dots) were performed. Estimation plots are shown where the left y-axis denotes relative fluorescent intensity (RFU, pixels) and the right y-axis reflects the effect size (black bar), which is the difference between means of each condition. Data are represented as mean ± standard deviation. ****p < 0.0001. Unpaired T-test was performed. F-I Flow cytometry was performed to evaluate cell surface expression of (F) ICAM-1, (G) JAM-A, H, ALCAM, and (I) PECAM following 24-h treatment with cocaine (10 μM, burgundy) or vehicle (teal). Fluorescence (arbitrary units) was evaluated for the specific protein of interest or following staining with an irrelevant, nonspecific isotype matched negative control antibody (IgG1). Data from one representative experiment, out of four individual experiments, are shown. (J-K) Western blot was performed to evaluate (J) claudin-5 and (K) occludin total protein expression in endothelial cells following 24-h treatment with cocaine (10 μM, burgundy) or vehicle (teal). β-actin was used for protein normalization. Western blots demonstrating six independent experiments are shown (left). The fold change in relative band intensity for each protein relative to β-actin was determined by densitometry where vehicle treatment (teal) was set to 1 (right). Six independent experiments (represented by individual dots) were performed. Estimation plots are shown where the left y-axis denotes fold change in relative band intensity for the protein of interest relative to β-actin and the right y-axis reflects the effect size (black bar), which is the difference between means of each condition. Data are represented as mean ± standard deviation

