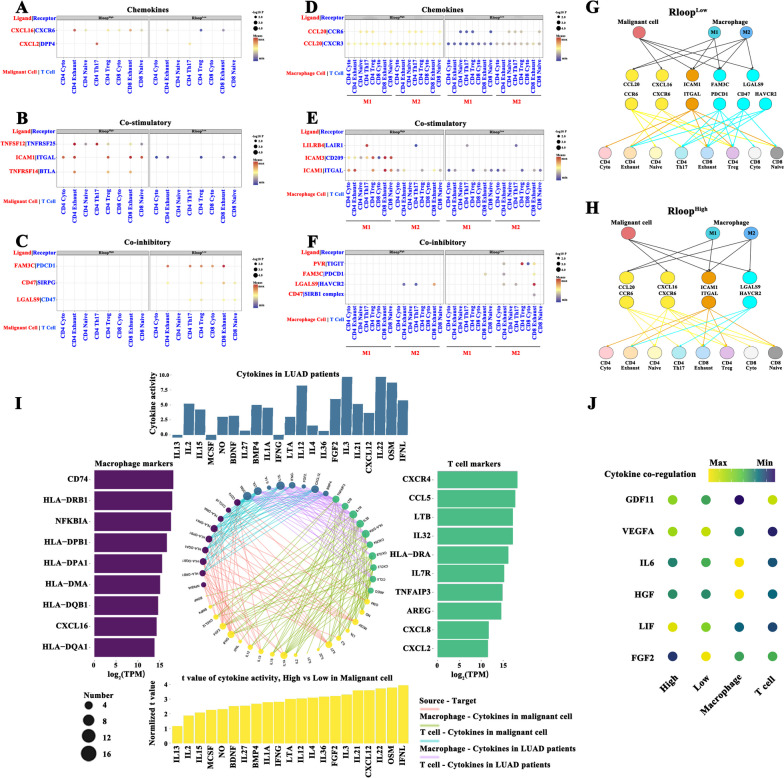
Fig. 3.
Cell communication and cytokine-associated pathway network analysis. A-C Intercellular interactions between malignant cells and T cell subtypes through chemokines (A), costimulatory molecules (B), and coinhibitory molecules (C). Circle size showing p values, and the color indicating the expression levels of ligand-receptor molecules. D-F Intercellular interactions between M1/M2-like macrophages and T cell subtypes via chemokines (D), costimulatory molecules (E), and coinhibitory molecules (F). G-H Ligand-receptor connections between malignant cells/macrophages and T cell subtypes under R-loop high-score (G) or low-score (H) conditions. Ligand-receptor molecules colored in yellow (chemokines), brown (costimulatory molecules), and cyan (coinhibitory molecules). I The activity of 21 cytokine pathways identified from malignant cells with high R-loop scores or patients with LUAD shows a positive relationship with macrophage marker and T cell marker genes (r > .2, p < .05). Circle size indicates the proportion of marker genes. J Signaling activities of multiple cytokines in malignant cells with high and low R-loop scores, T cells, and macrophages. The values of the activity of each cytokine are distinguished by color

