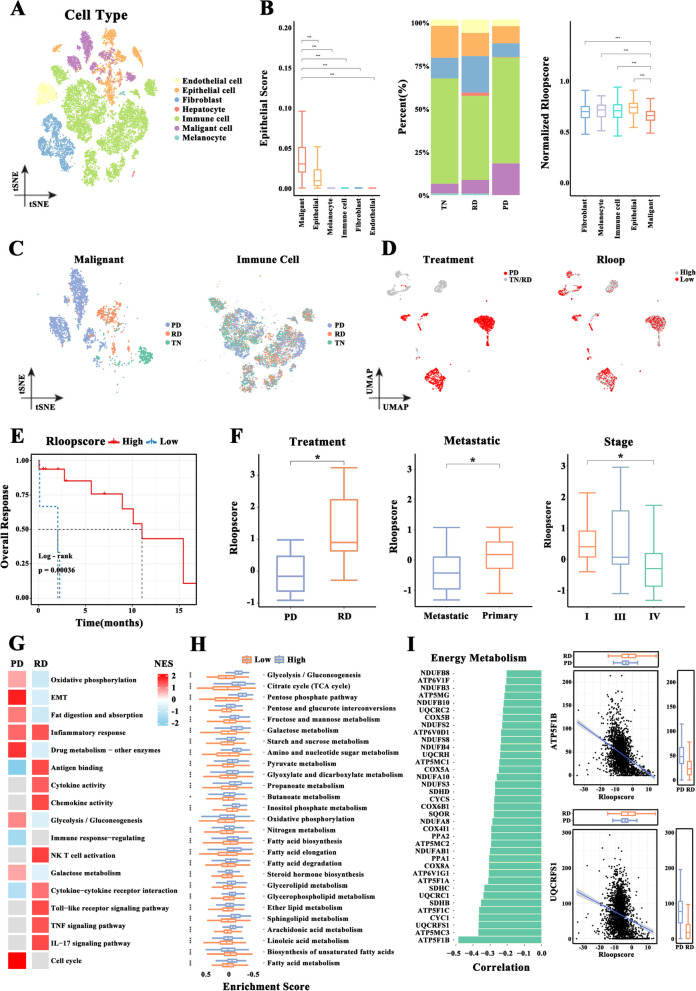
Fig. 4.
R-loop score positively correlated with tyrosine kinase inhibitor (TKI) treatment response. A Uniform manifold approximation and projection (UMAP) plot of 23,420 cells of 30 samples from the National Center for Biotechnology Information (NCBI) BioProject (PRJNA591860); they are colored according to cell type. B Epithelial scores for each cell type such as malignant cells, epithelial cells, melanocytes, immune cells, fibroblasts, and endothelial cells according to the expression of epithelial marker genes. The distribution of these cell types in patients with initiating targeted therapy (TN), complete or partial response state (RD), and progressive disease (PD). The differences in the R-loop score among these cell types (Wilcoxon rank test). C T-distributed stochastic neighbor embedding (t-SNE) plot of malignant cells or immune cells colored according to TKI subgroup. D UMAP plot of malignant cells colored according to TKI subgroup or R-loop score. E The difference in the overall survival rates between patients with high and low R-loop scores (log-rank test). F R-loop scores of cancer samples calculated according to the mean value of the total number of cells (Wilcoxon rank test). G The enriched pathways of malignant cells with high R-loop scores in PD and RD samples. Normalized enrichment score (NES) indicates the score for enriched signal pathways. H Gene set variation analysis (GSVA) showing the differences in the enriched metabolism–related pathways between malignant cells with high and low R-loop scores (Wilcoxon rank test). I Energy metabolism–associated genes negatively related to R-loop score. The scatterplot displaying the relationship between identified genes such as ATP5F1B and UQCRFS1, and R-loop score. The marginal boxplots on x-axis and y-axis show the distribution of R-loop scores and the expression level of identified genes, respectively. (*p < .05, **p < .01, ***p < .001)

