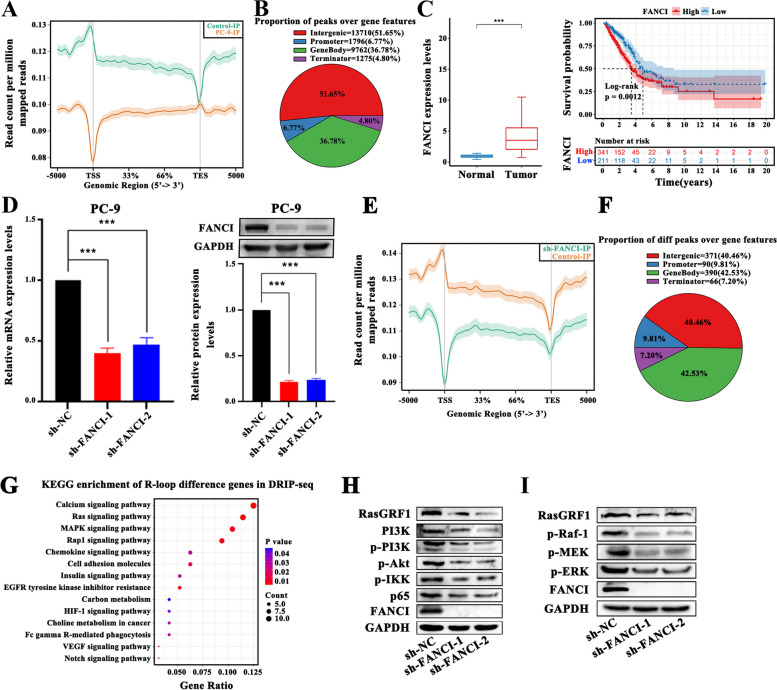
Fig. 7.
FANCI knockdown affected R-loop distribution inhibiting the Ras signaling pathway. A Genome-wide R-loop signal profile for PC-9. B The percentages of R-loop peaks are distributed as intergenic, promoter, genebody, and terminator regions. C The difference in FANCI expression between tumor and normal control tissues from TCGA-LUAD (Wilcoxon rank test), and the difference in the overall survival probability between patients with high and low FANCI expression (log-rank test). D shRNAs induced gene silencing, reducing FANCI mRNA and protein levels (Student’s t-test). E Comparison of R-loop signal profile between PC-9 and PC-9 with FANCI knockdown. F The proportion of different R-loop peaks in intergenic, promoter, genebody, and terminator regions between PC-9 and PC-9 with FANCI knockdown. G The Kyoto Encyclopedia of Genes and Genomes (KEGG) analysis for genes with a statistically significant difference in the R-loop distribution between control and FANCI-knockdown PC-9 cells. H-I FANCI silencing decreased the protein levels of RasGRF1, p-PI3K, p-AKT, p-IKK, p-65 (H), and p-Raf1, p-MEK, and p-ERK in PC-9 cells (I). Transcription start site (TSS) and transcription termination site (TTS). (*p < .05, **p < .01, ***p < .001)

