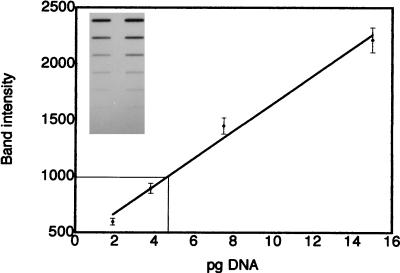
FIG. 3.
Genomic reconstruction. Inset photo shows a representative autoradiograph of G186AS DNA and calmodulin probe. The lane on the left shows twofold serial dilutions of genomic DNA starting with 400 ng. The lane on the right shows twofold serial dilutions of H. capsulatum calmodulin probe starting with 15 pg. The nitrocellulose blot was probed with radiolabeled H. capsulatum calmodulin probe. The graph depicts a standard curve of relative band intensity plotted against the amount of calmodulin (inset, lane 2). Each bar shows the standard deviation of triplicate experiments. As an example, the thin line represents the intensity of the 100-ng genomic band and yields an estimate of 4.7 pg of calmodulin target per 100 ng of genomic DNA.

