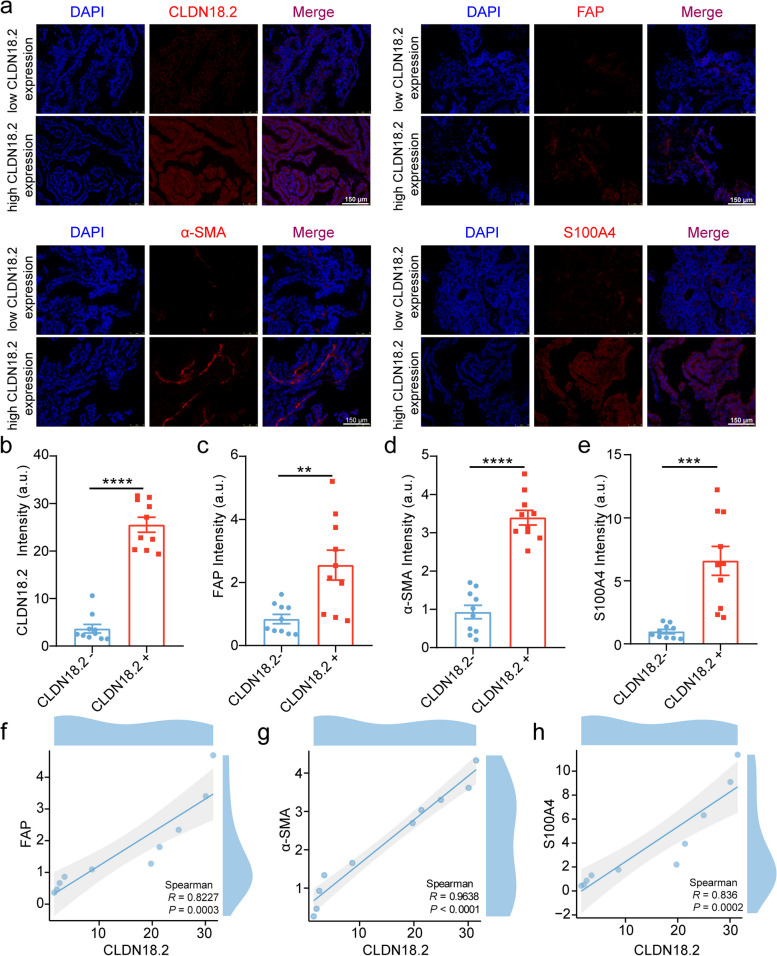
Fig. 2.
CLDN18.2 expression shows a positive correlation with the level of infiltration by CAFs. a. PDX tumors with negative and positive CLDN18.2 staining was analyzed using paraffin immunofluorescence with anti-CLDN18.2 (red), anti-FAP (red), anti-α-SMA (red), and anti-S100A4 (red) antibodies. Nuclei were counterstained with DAPI (blue). Scale bars represent 150 μm. b-e. The quantitative analysis of immunofluorescence intensity of CLDN18.2, FAP, α-SMA, and S100A4 expression was performed based on the results shown in Fig. 2a. f-h. The Spearman correlation analysis was used to assess the relative expression levels of FAP, α-SMA, S100A4, and CLDN18.2, as shown in Fig. 2b-e. all data were shown as the mean ± SEM, and data were analyzed using Student’s t-tests, **P < 0.01, ***P < 0.001, and ****P < 0.0001

