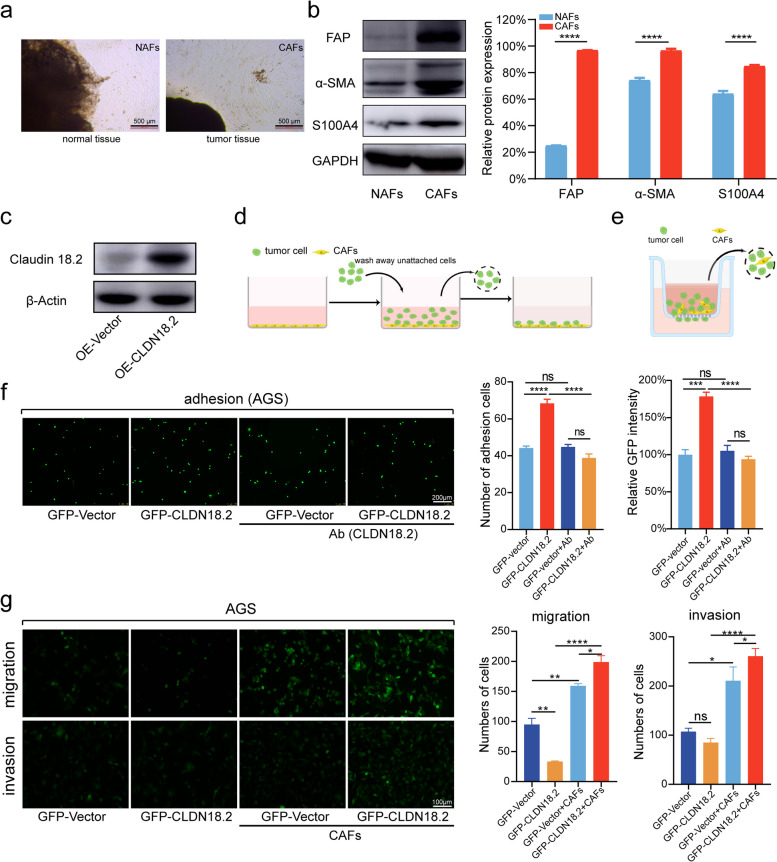
Fig. 3.
CAFs enhance the adhesion and migration of gastric cancer cells expressing CLDN18.2 in vitro. a. Representative images of CAFs were employed to verify the reliability of CAFs isolated from gastric cancer tissue. b. The protein levels of FAP, α-SMA, and S100A4 in CAFs were evaluated based on the results shown in Fig. 3a. The data were shown as the mean ± SEM and analyzed using Student’s t-tests, ****P < 0.0001. c. The protein levels of CLDN18.2 were measured in AGS cells infected with CLDN18.2 lentivirus. d. The schematic diagram depicting the gastric cancer cell-CAFs adhesion model was provided. e. The schematic diagram of the gastric cancer cell-CAFs co-culture migration assay was illustrated. f. Adhesion of AGS cells expressing GFP or GFP-CLDN18.2 to CAFs was evaluated in the presence or absence of CLDN18.2 antibody blocking, and representative images are shown. The scale bar represents 200 μm. g. AGS cells expressing GFP or GFP-CLDN18.2 were co-cultured with or without CAFs, and their migration and invasion abilities were measured. Statistical analysis was performed accordingly, and the scale bar represents 100 μm. The data were shown as the mean ± SEM and analyzed using one-ANOVA test in Fig. 3f, g, *P < 0.05, **P < 0.01, ***P < 0.001 and ****P < 0.0001, ns: no significant

