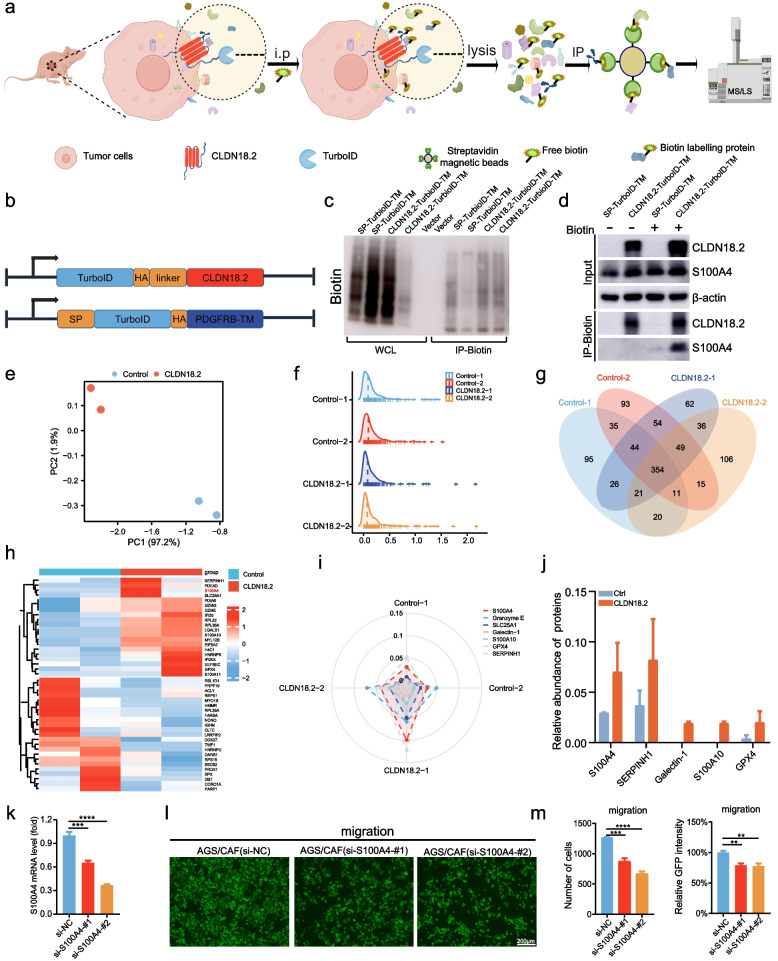
Fig. 6.
S100A4 secreted by CAFs promotes the adhesion of CLDN18.2-expressing gastric cancer cells. a. Schematic diagram of proximity-dependent biotin identification in vivo. b. Schematic diagram of plasmid construction. The N-terminus of CLDN18.2 was coupled to HA-turboID with a linker, HA-turboID was coupled to the N-terminus of PDFGRB with a linker. HA: haemagglutinin tag. TurboID: biotin ligase. SP: signal peptide. c. Lentivirus was used to stably express SP-TurboID-TM and CLDN18.2-TurboID in AGS cells, which were subsequently employed to form subcutaneous tumors in mice. After intraperitoneal injection of biotin, the tumor tissue from each mouse was subjected to proximity-dependent biotin identification. We present representative photographs of western blots from tumor tissues. d. Stable AGS cell lines expressing either SP-TurboID-TM or CLDN18.2-TurboID-TM were utilized for co-culturing with CAFs over 24 hours. Subsequently, 500 μM biotin was introduced to the co-culture system for 60 minutes, facilitating TurboID-mediated biotinylation of proteins proximal to CLDN18.2. Two control groups were maintained, devoid of biotin treatment. Ultimately, total protein fractions were harvested and subjected to western blot analysis for the assessment of CLDN18.2 and S100A4. The inclusion of β-actin served to validate consistent total protein loading across all experimental groups. e-f. Analysis of data characteristics (e) and data distribution (f) was performed. g. Venn diagram showing the overlapped proteins and unique proteins associated with tumor tissue expressing CLDN18.2-TurboID. h. Heat map showing the top 20 up-regulated and down-regulated proteins. i. Radar chart showing the top up-regulated proteins. j. The histogram showing the relative abundance of S100A4, SERPINH1, Galectin-1, S100A10, and GPX4. k. S100A4 was silenced by siRNA in CAFs. l-m. The adhesion of GFP-labeled AGS cells upon co-culture with S100A4-knockdown CAF cells were assessed (l), and representative images are shown (m). The scale bar represents 200 μm. All data were shown as the mean ± SEM, and data were analyzed using One-way ANOVA test, **P < 0.01, ***P < 0.001 and ****P < 0.0001

