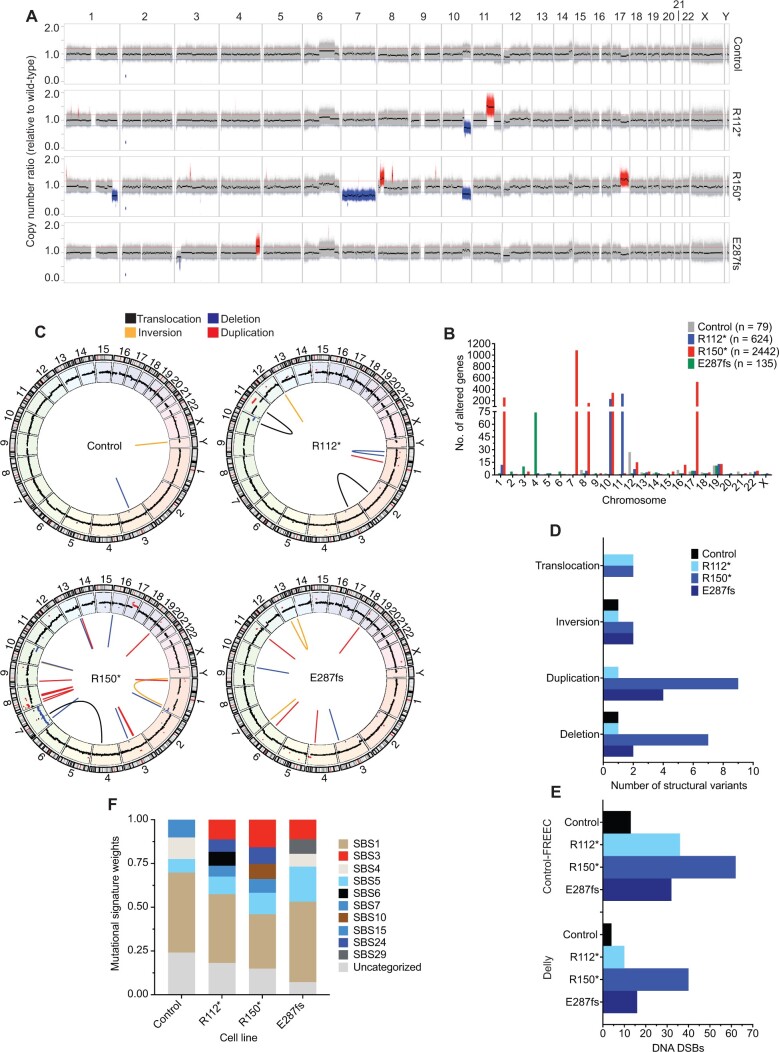
Figure 3.
Neuroblastoma IMR-5 BARD1+/mut cell lines exhibit widespread genomic instability. A) Copy number ratio across the genome for the IMR-5 nontargeted control clone and BARD1+/mut isogenic clones relative to wild-type parental IMR-5 cells. Large acquired genomic losses are indicated in blue (fold change < 0.8) and gains in red (fold change > 1.2). B) Quantification of the number of genes found within copy number variant-altered genomic regions in the IMR-5 BARD1+/mut and control isogenic cell lines shown in panel A. Total number of altered genes for each isogenic cell line is shown in the legend. C) Circos plots depicting structural variants identified in nontargeted control and BARD1+/mut IMR-5 cells. Copy number segments from panel A are shown in the outer circle for reference. D) Counts of structural variants in nontargeted control and BARD1+/mut IMR-5 cells. E) Counts of DNA double-strand breaks in nontargeted control and BARD1+/mut IMR-5 cells, quantified from the Control-FREEC copy number data (top) and Delly structural variant data (bottom). F) Plot of mutational signature weights in nontargeted control and BARD1+/mut IMR-5 cells using COSMIC mutational signatures v2. DSB = double-strand break.

