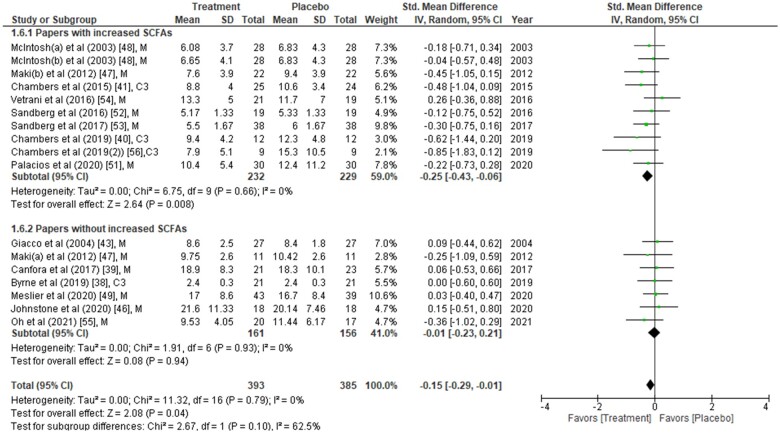
Figure 2.
Fasting insulin concentrations from each study were compared between placebo group and treatment group at the end of the intervention period. Data are presented as the standardized mean difference (SMD) in fasting insulin (µU/mL) and have been separated into two subgroups: one with evidence of an increase in short-chain fatty acids (SCFAs) concentration(s) post intervention, and the other without any change in SCFAs post intervention. The type of intervention (M, meal/mixed; C3, propionate) is noted at the end of each study. Abbreviation: IV, inverse variance.

