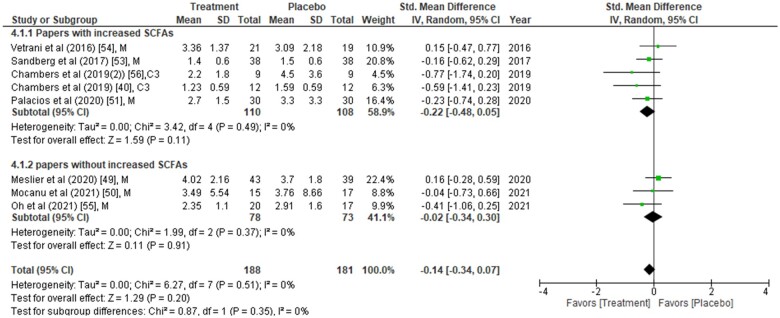
Figure 4.
Homeostatic model assessment of insulin resistance (HOMA-IR) values were compared between placebo group and treatment group at the end of the intervention period. Data are presented as the standardized mean difference (SMD) in HOMA-IR and have been separated into two subgroups: one with evidence of an increase in short-chain fatty acids (SCFAs) concentration(s) post intervention, and the other without any change in SCFAs post intervention. The type of intervention (M, meal/mixed; C3, propionate) is noted at the end of each study. Abbreviation: IV, inverse variance.

