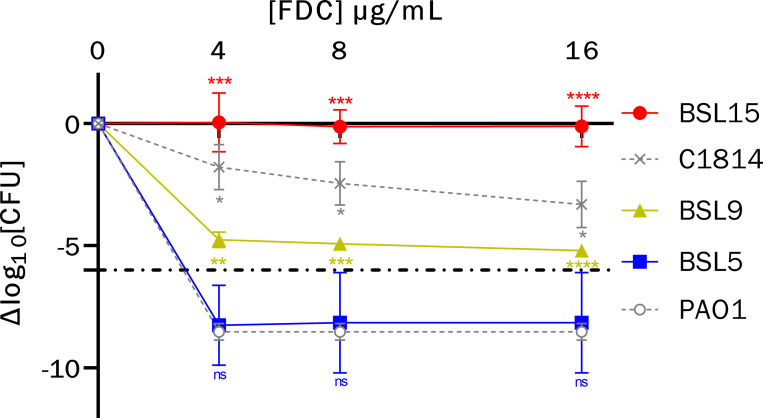
Fig 1.
Population analysis profiles of sequentially collected multi-drug-resistant P. aeruginosa. Isolate profiles were compared to representative susceptible control (PAO1, open circle) and heteroresistant control (C1814, X) phenotypes. Dash-dot line represents the cutoff for heteroresistance. Error bars represent 95% confidence intervals across triplicate runs with a controlled inoculum of approximately 107–108. P-values for comparison of individual isolate growth relative to PAO1: ns, not significant, * ≤0.05, ** ≤0.01, *** ≤0.001, **** ≤0.0001.

