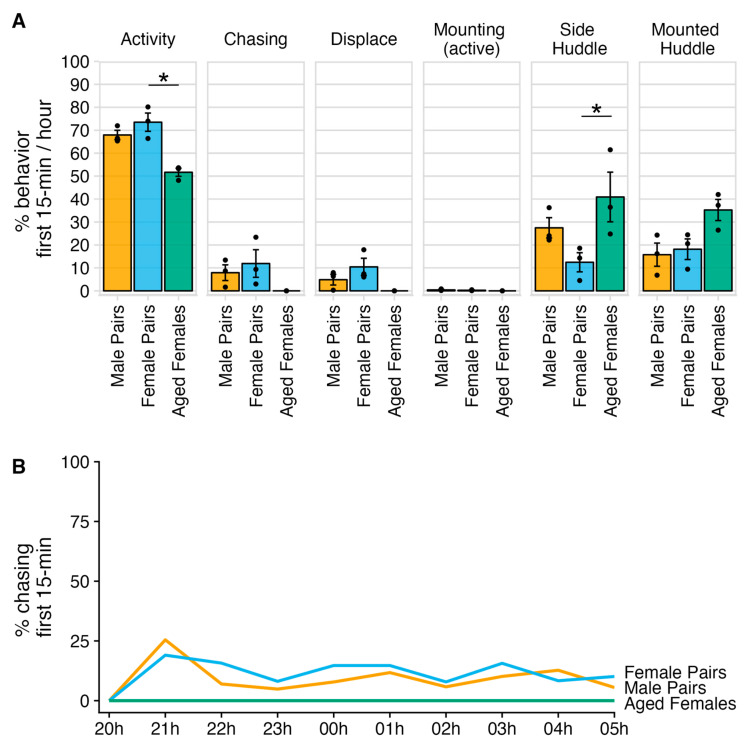
Figure 4.
Agonistic and huddling behaviors observed during the night. (A) Panel of bar plots for each measured behavior for the different housing conditions. Bars represent the mean percent of the behavior observed in the first 15 min of every hour for each housing condition; error bars represent the standard error of the mean; and individual points represent the mean value per cage. Aged females had significantly lower activity scores than female pairs (Z = −2.385, padj = 0.05) and side-huddled significantly more than female pairs (Z = 2.534, padj = 0.034). (B) Time-series line graph of chasing for the different housing conditions across each hour of the night. Intersections between the x-axis breaks and line represent mean percent of chasing observed in the first 15 min for the respective hour. The * refers to a significant effect with a p-value ≤ 0.05.

