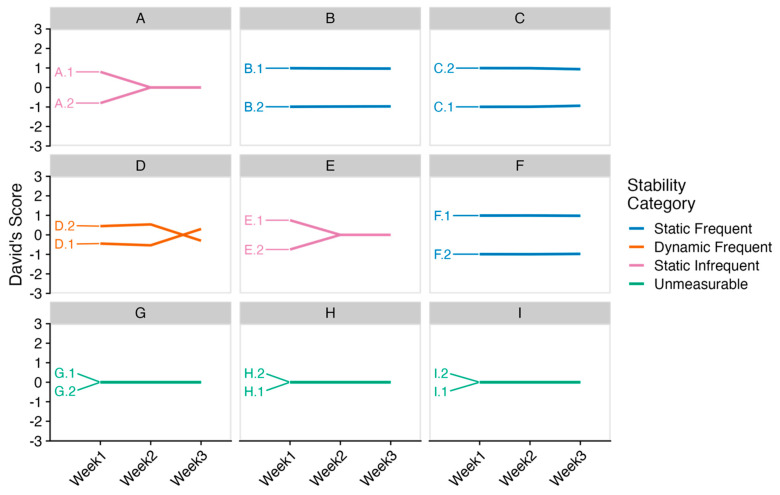
Figure 5.
Stability of dominance behavior across three weeks. Panel of line graphs of David’s scores across three weeks for each cage, denoted by the letter. Each line represents an animal, which is labeled the cage letter (e.g., A) and animal number identification (e.g., A.1). The cage letters match those in Table 3. The top row is male pairs, the middle row is female pairs, and the bottom row is aged females.

