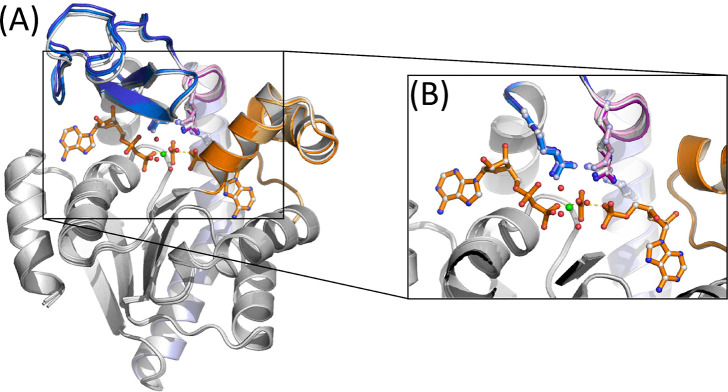
Figure 7.
Superposition of the AdK structure obtained from the alchemical transformation simulation between RS and PS: (A) overall structure and (B) zoom-in view of the active site showing the relative orientation of the R123, 156, and 167 residues and the catalytic loop between RS (λ = 0.0) and PS (λ = 1.0). In the figure, the CORE subdomain is shown in gray cartoons, blue and light blue cartoons for the ATP lid (blue for RS and light blue for PS), and orange and light orange cartoons for the AMP lid (orange for RS and light orange for PS). The catalytic loop shown in purple is for RS and light pink is for PS. In addition, the gray cartoon is shown for the TS-mimic state, i.e., the λ = 0.5 state.

