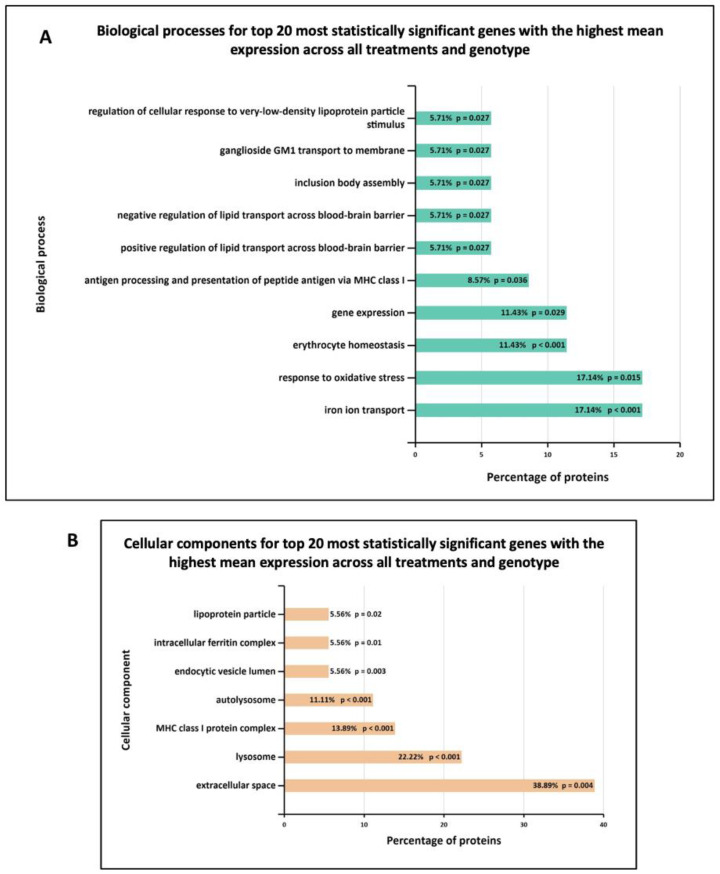
Figure 8.
GO enrichment analysis of the top twenty most statistically significant genes with the highest mean expression across all treatments and genotype. GO (A) biological process and (B) cellular component enrichment analyses of top twenty most statistically significant differentially expressed genes across all samples (from Figure 5) were performed using the FunRich functional enrichment analysis tool. Significantly enriched GO terms are shown with Benjamini–Hochberg and Bonferroni-corrected p-values. Statistical significance was taken at p < 0.05.

