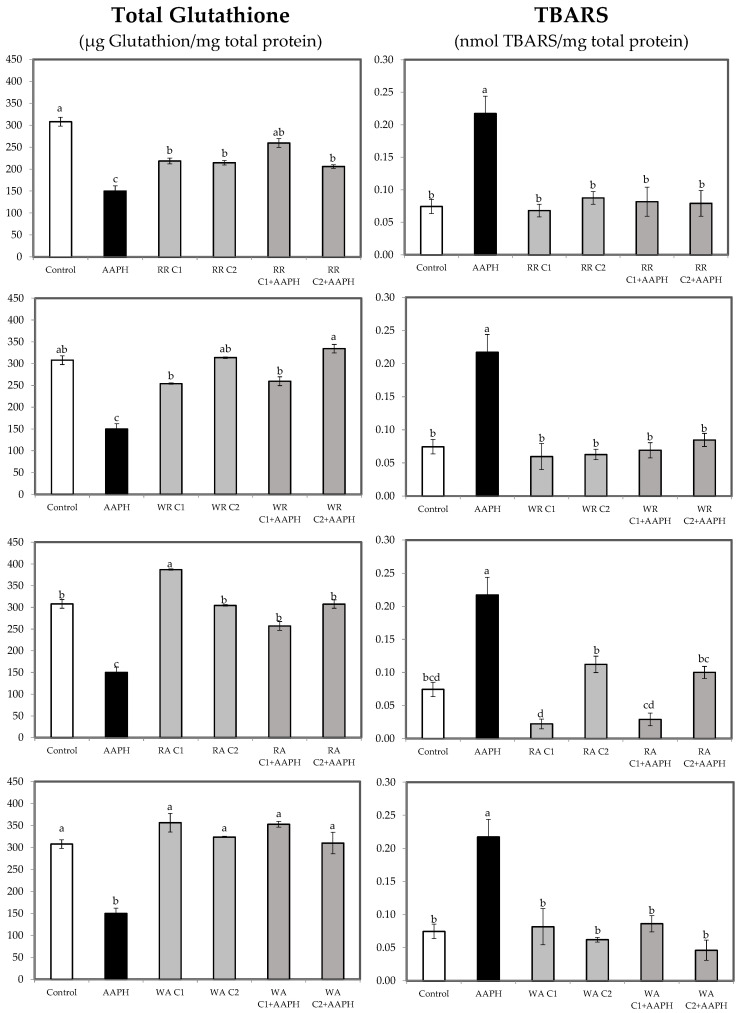
Figure 6.
Total glutathione and TBARS in HepG2 cells treated with two concentrations of receptacle and achenes for 24 h or AAPH (2.5 mM) for 24 h with two concentrations of receptacle and achenes, then stressed with AAPH. Data are expressed as mean values ± SE. Columns with different superscript letters are significantly different (p < 0.05). CTL: cells without treatment; AAPH: cells incubated with AAPH; RR: cells incubated with red receptacle; WR: cells incubated with white receptacle; RR + AAPH: cells preincubated with red receptacle, then stressed with AAPH; WR + AAPH: cells preincubated with white receptacle, then stressed with AAPH; RA: cells incubated with red achenes; WA: cells incubated with white achenes; RA + AAPH: cells preincubated with red achenes, then stressed with AAPH; WA + AAPH: cells preincubated with white achenes, then stressed with AAPH; C1: concentration 1 (10 µg/mL for receptacle and 0.25 µg/mL for achenes); C2: concentration 2 (25 µg/mL for receptacle and 0.5 µg/mL for achenes).

