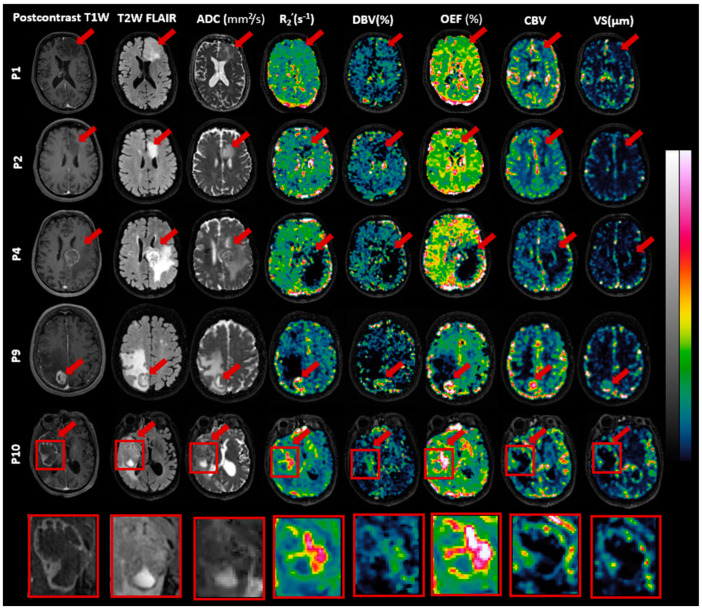
Figure 4.
Exemplary slices of images including postcontrast T1-weighted (T1W), T2-weighted fluid-attenuated inversion recovery (T2W FLAIR), apparent diffusion coefficient (ADC), reversible transverse relaxation rate (R2′), deoxygenated blood volume (DBV), oxygen extraction fraction (OEF), cerebral blood volume (CBV), and vessel size are presented for patients P1 (oligodendroglioma), P2 (astrocytoma), P4 and P9 (brain metastasis), and P10 (glioblastoma). Red arrows highlight the tumors. Intensity scales vary across images, with ADC ranging from 0 to 3 × 10⁻³ mm2/s, R2′ from 0 to 20 s−1 (0–40 s−1 for P10), DBV from 0 to 50% (0–100% for P10), OEF from 0 to 100% (0–200% for P10), CBV from 0 to 10, and vessel size from 0 to 300 µm. A detailed view of P10’s tumor area is included.

