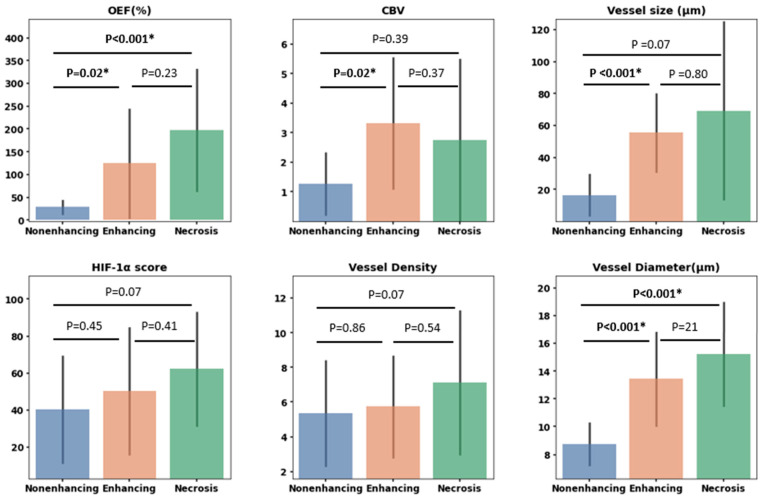
Figure 6.
Bar plots illustrating measurements for various parameters. The top row displays oxygen extraction fraction (OEF), cerebral blood volume (CBV), and vessel size. The bottom row displays hypoxia-inducible factor 1-alpha (HIF-1α) expression, vessel density as determined by CD31 expression, and vessel diameter based on CD31-highlighted vessels. These measurements are derived from targeted biopsies situated within three VOIs: nonenhancing, enhancing, and necrosis VOIs. Statistically significant differences based on the Mann–Whitney U test are marked with *, with p-values detailed above each respective comparison.

