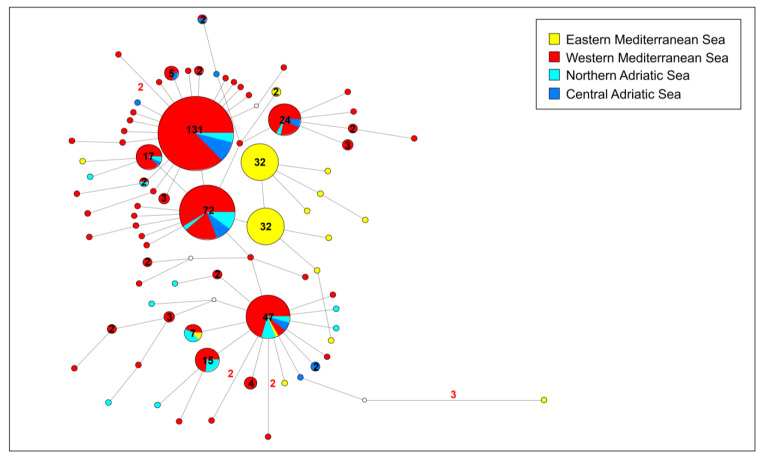
Figure 2.
Median-joining network analysis performed on the COI gene fragment. The small white spots on the nodes show median vectors representing the hypothetical sequences that were calculated using the maximum parsimony method. The number of mutations between haplotypes that are greater than n = 1 are reported on the network branches. Additionally, the number of individuals showing the same haplotype that is greater than n = 1 are reported inside the spot.

