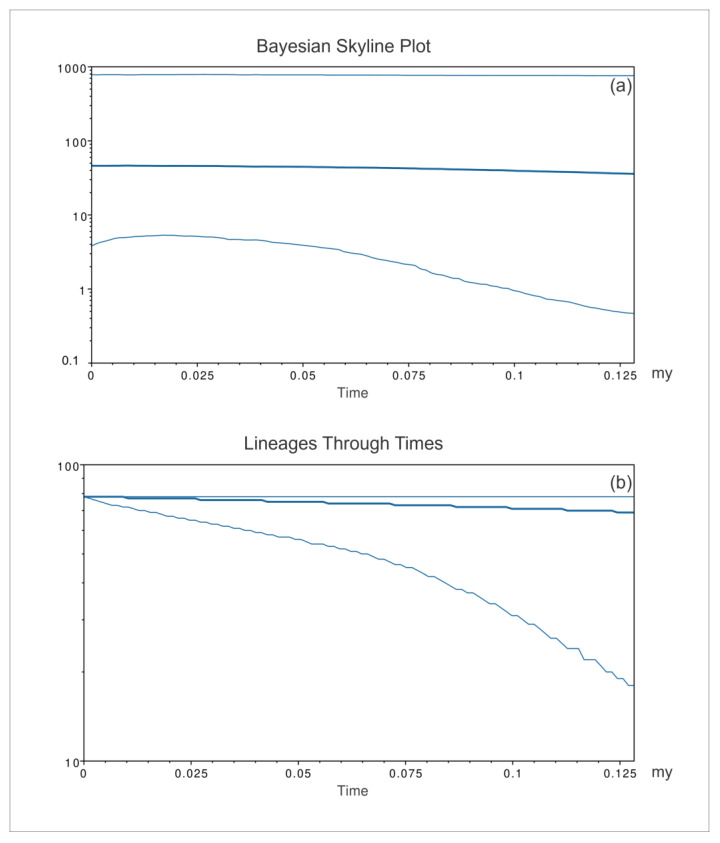
Figure 9.
Bayesian skyline plot (a) and lineages through time (b) for the eastern Mediterranean populations of Pinna nobilis. The effective population size and the number of lineages in the y-axis are shown as a function of million years (my). The thicker central line represents the median value, while the thinnest lines delimit the 95% high posterior density (HPD) region.

