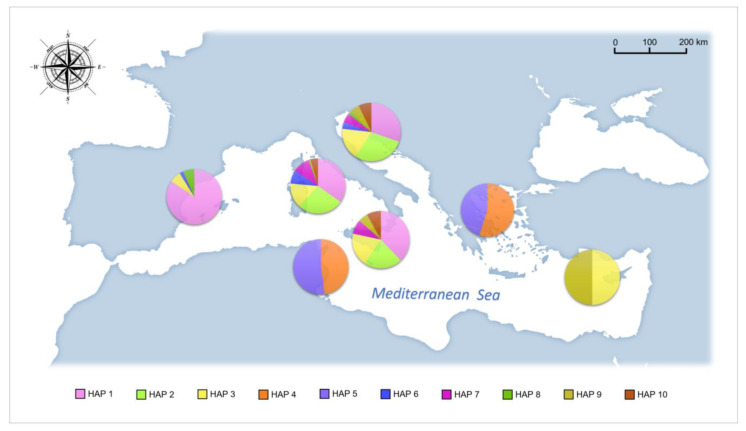
Figure A1.
Map showing the distribution of the most common COI haplotypes within the whole Mediterranean basin. In the figure, only haplotypes shared by 5 or more individuals are represented. The number of each haplotype, which is reported in the bottom of the figure, do not refer to a specific nomenclature.

