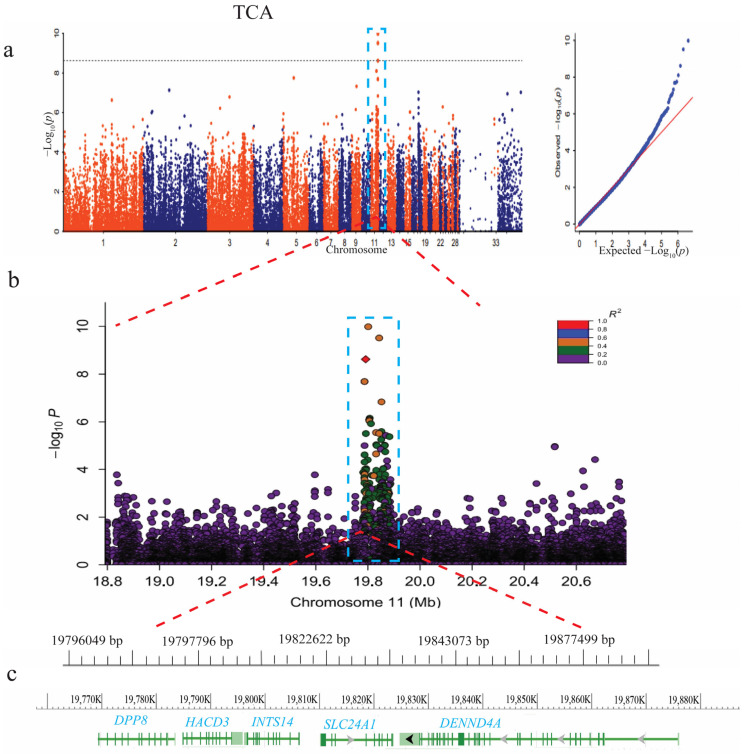
Figure 4.
GWAS analysis of the total color area (TCA) of the dorsal side feathers. (a) Manhattan plot of the total color area. (b) LocusZoom plot for the loci ranging from 18.8 kb to 20.6 kb (the R2 color scale represents the different threshold of R2 values: purple is r2 > 0.0, green is r2 > 0.2, orange is r2 > 0.4, blue is r2 > 0.6, and red is r2 > 0.8). (c) There are five genes in the candidate region.

