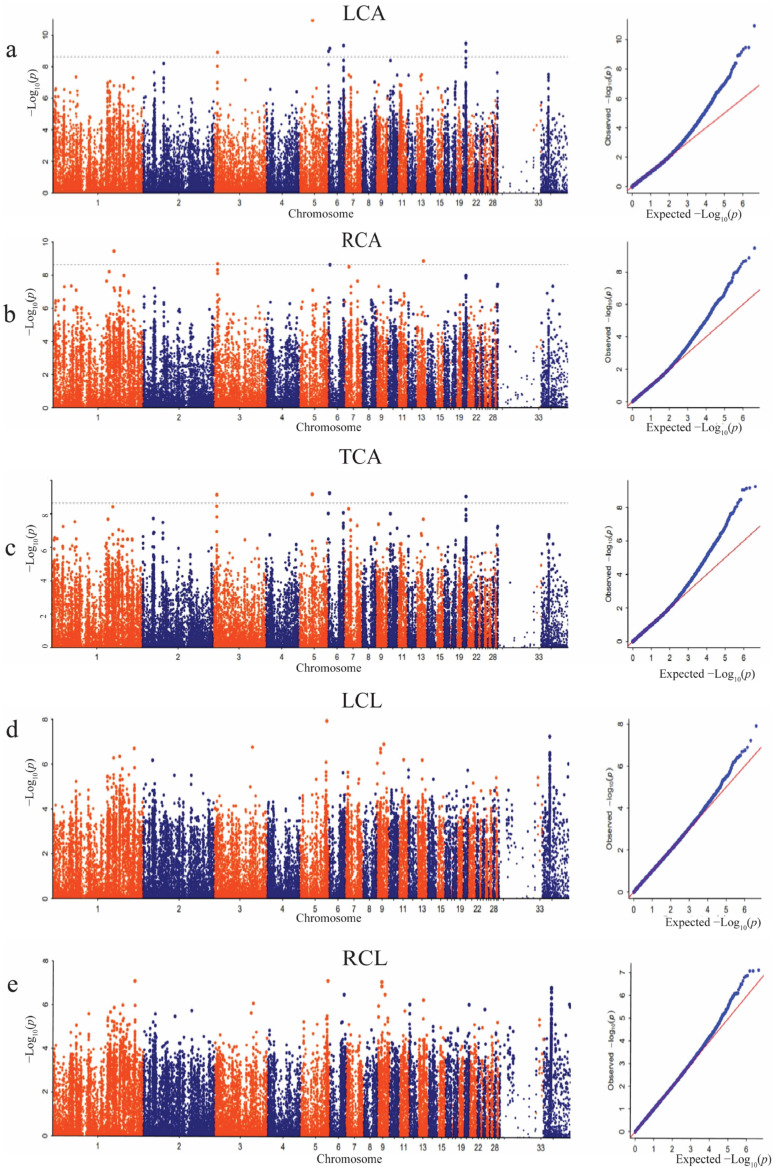
Figure 5.
Manhattan and QQ plots for the ventral feather color traits. (a) Left color area (LCA). (b) Right color area (RCA). (c) Total color area (TCA). (d) Left color length (LCL). (e) Right color length (RCL). The x-axis depicts the physical locations of each SNP along the chromosome, while the y-axis depicts the −Log10(p) values of SNP. The gray dotted lines signify the Bonferroni threshold level (correction threshold = 8.59).

