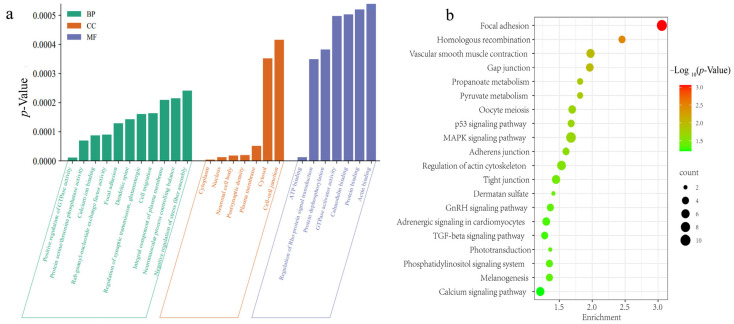
Figure 6.
GO and KEGG enrichment analysis of the candidate genes. (a) GO enrichment analysis for the candidate genes. The y-axis indicates the p-values; the x-axis indicates the GO terms. Bars represent the p-value of each GO term. (b) KEGG enrichment analysis for the candidate genes. The x-axis represents the gene ratio, and the y-axis represents the KEGG pathways. The dot color represents the p-value, and the dot size represents the number of genes enriched in the reference pathway. Smaller −Log10 (p-values) are indicated by green, and larger values are indicated by red color.

