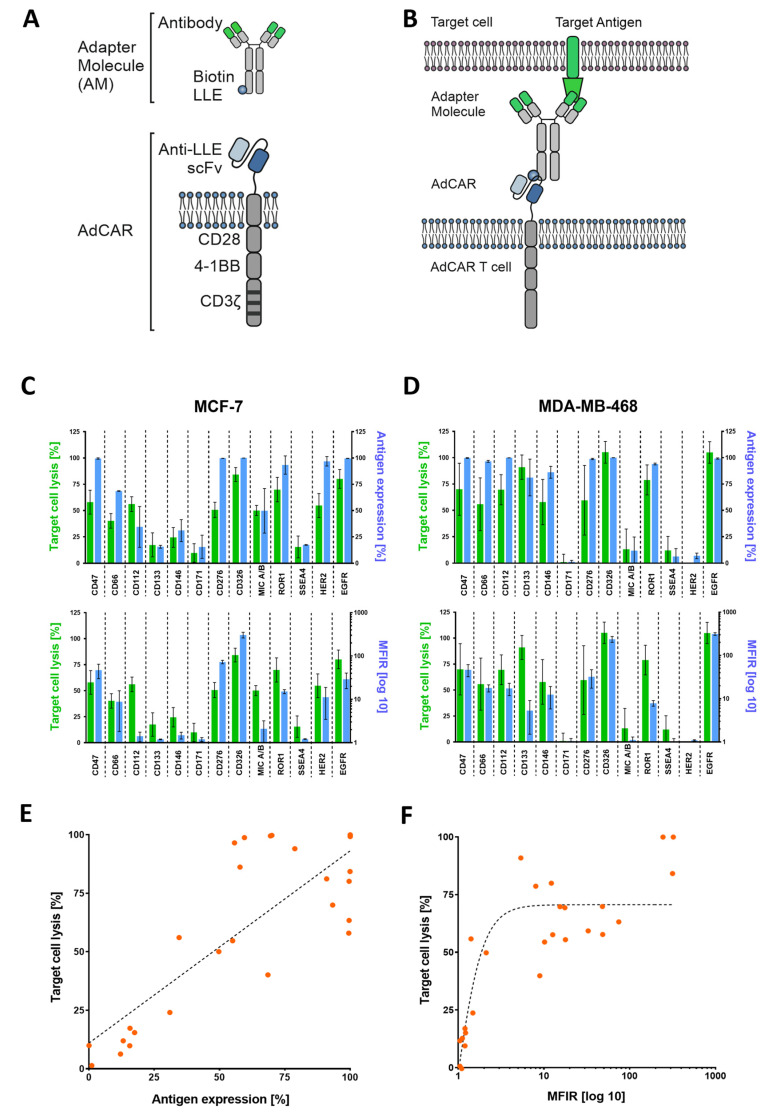
Figure 1.
AdCAR-T cell design and functional targeting of BC cell lines using adapter molecules (AMs). (A) Schematic illustration of an adapter molecule and AdCAR-T cell receptor. (B) AdCAR-T cells are directed towards the target antigen via LLE-conjugated biotinylated antibodies referred to as AMs. (C,D) Comparison of target cell lysis of MCF-7 and MB-MDA-468 (green bars) to either overtone positive antigen expression (upper blue bars) or mean fluorescence intensity ratio (MFIR) log 10 of antigen expression (lower blue bars). Target cell lysis was determined via luciferin-based cytotoxicity assay after 48 h with an E:T ratio of 2:1. Antigen screening with respective antibodies was performed via flow cytometry (FC) and is represented by mean values (n = 6) ± SD. (E) Correlation between target cell lysis and antigen expression of both cell lines analyzed via linear regression resulted in a Spearman correlation coefficient of 0.66. (F) Analyzing exponential regression for the correlation of target cell lysis and MFIR log 10 of both cell lines showed a Spearman coefficient of 0.77. All data used in (E,F) are depicted by mean values (n = 6).

