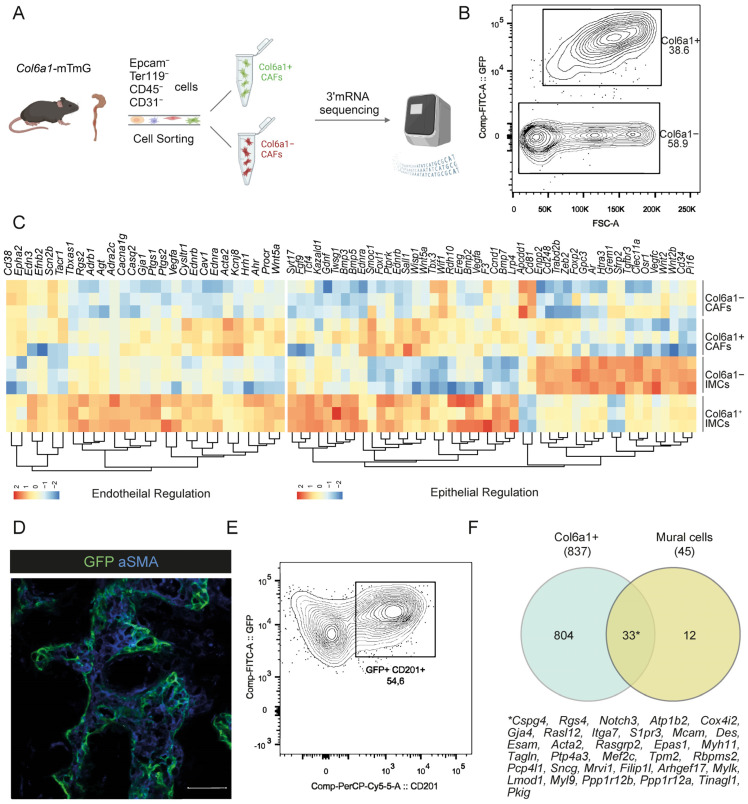
Figure 1.
Col6a1+ CAFs and normal fibroblasts display transcriptional similarities. (A) Schematic showing the procedure for bulk RNA sequencing of fibroblasts isolated from AOM/DSS-induced adenomas (prepared using Biorender.com). A total of three samples were used for bulk RNA sequencing. Each sample originated from a pool of tumors from five to six mice. (B) FACS plot showing the sorting strategy for Col6a1+ and Col6a1− CAFs. (C) Heatmap showing gene expression signatures of Col6a1+ and Col6a1− fibroblasts in homeostasis (IMCs) and CAC (CAFs). Log2-transformed normalized read counts of genes for each replicate are shown. Red denotes high expression, and blue denotes low expression values. Read counts are scaled per column. (D) Immunohistochemistry for αSMA in AOM/DSS-induced adenomas of Col6a1-mTmG mice (n = 5 mice, Scale bar: 50 μm). (E) Representative FACS analysis of CD201 expression in Lin−GFP+ cells in AOM/DSS-induced adenomas of Col6a1-mTmG mice (n = 2 mice). (F) Venn diagram showing similarities in gene expression between Col6a1+ CAFs and mural cells [27].

