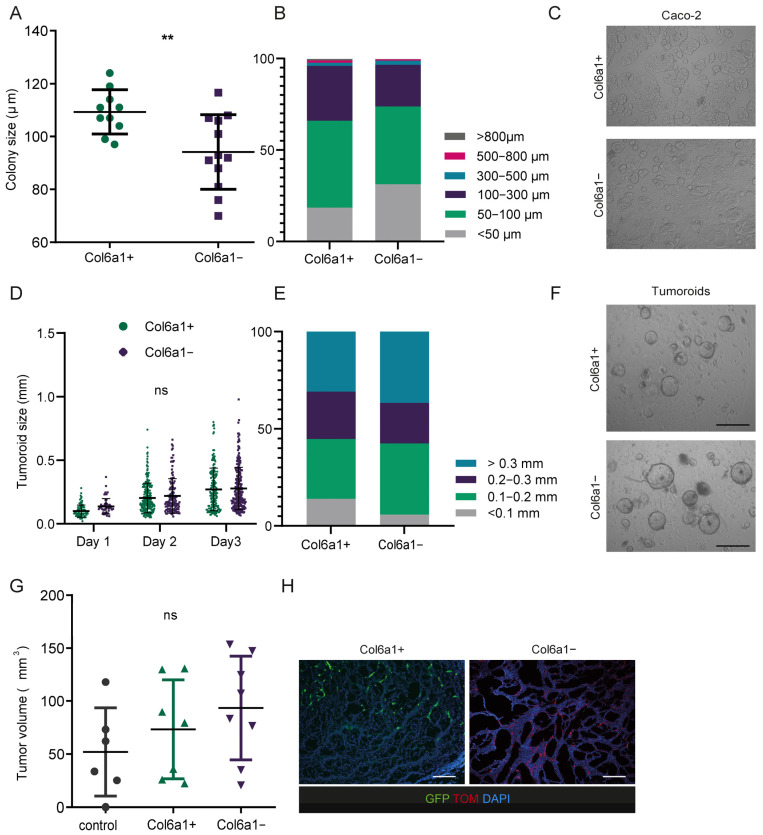
Figure 3.
Co-culture experiments and allografts show similar effects of Col6a1+ and Col6a1− CAFs on cancer cell growth. (A) Average colony size per well, (B) size distribution, and (C) representative bright field images of Caco-2 colonies after 3 days of culture on sorted Col6a1+ and Col6a1− colonic IMCs. Data represents mean ± SD from one of three experiments performed, n = 10–12 wells, ** p < 0.01, Scale bar = 0.5 mm. (D) Tumoroid size per condition for each day of the co-culture, (E) size distribution of tumoroids at day 3 of the co-culture, and (F) representative bright-field images of AOM/DSS tumoroids at day three of their co-culture with sorted Col6a1+ and Col6a1− colonic IMCs. Data represents mean ± SD of tumoroids from one of three experiments performed. ns = not statistically significant, Scale bar = 1 mm. (G) Total volume of allografts after 15 days of growth with Col6a1+ and Col6a1− colonic IMCs. Data represents mean ± SD from one of three experiments performed (n = 6–8), ns = not statistically significant. (H) Representative fluorescent images of allografts with sorted Col6a1+ and Col6a1− colonic IMCs. Scale bar = 50 μm.

