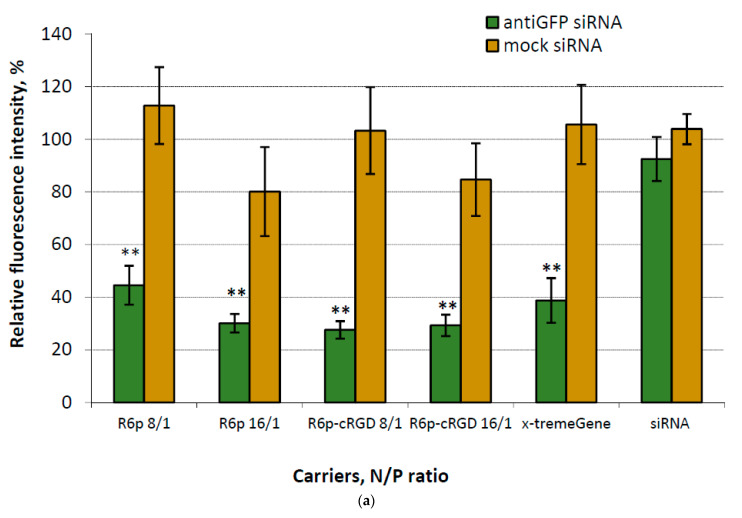
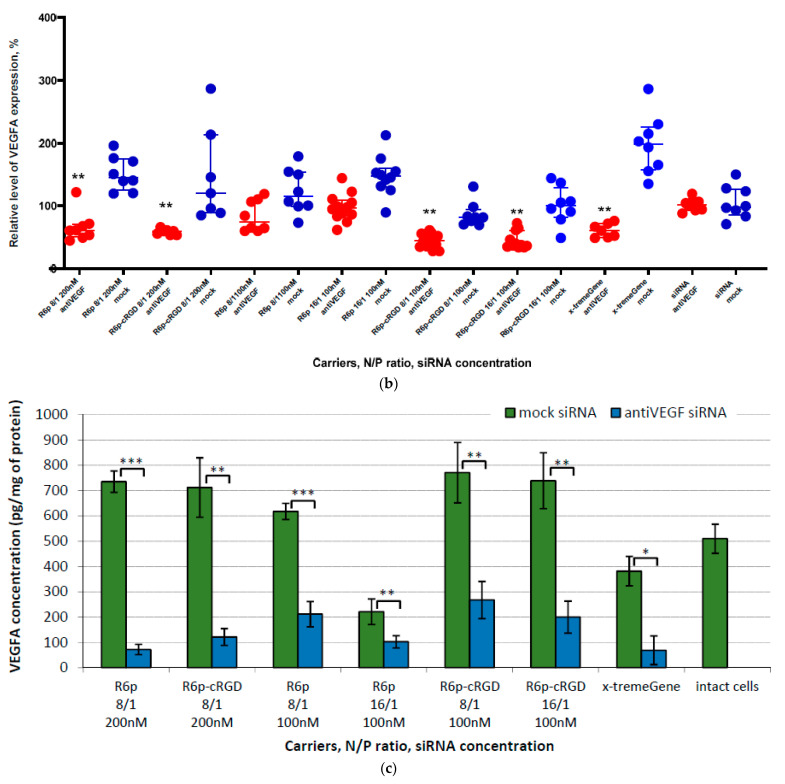
Figure 4.
siRNA transfection efficacy evaluation: (a)—silencing of GFP expression after treatment of MDA-MB-231-GFP+ cells with the siRNA-complexes at siRNA concentration 200 nM. **—p < 0.01 when compared with negative control. The data are shown as the mean ± S.D. of n = 9 individual samples from three independent experiments; statistical significance was assessed by ordinary one-way ANOVA; (b)—silencing of VEGFA gene expression after treatment of E.A.Hy926 cells with the anti-VEGFA siRNA-complexes (red circles) and mock siRNA-complexes (blue circles) at different siRNA concentrations. **—p < 0.01 when compared with negative control. The data are shown as the median ± interquartile range of n = 8 individual samples from four independent experiments; statistical significance was assessed by ordinary two-way ANOVA; (c)—VEGFA protein production (pg/total protein) by EA.Hy926 cells after the transfection with siRNA-complexes. *—p < 0.05, **—p < 0.01, ***—p < 0.001 when compared with cells treated by corresponding mock siRNA-complexes. The data are shown as the mean ± S.D. of n = 9 individual samples from three independent experiments; statistical significance was assessed by ordinary two-way ANOVA.


