
Figure 6.
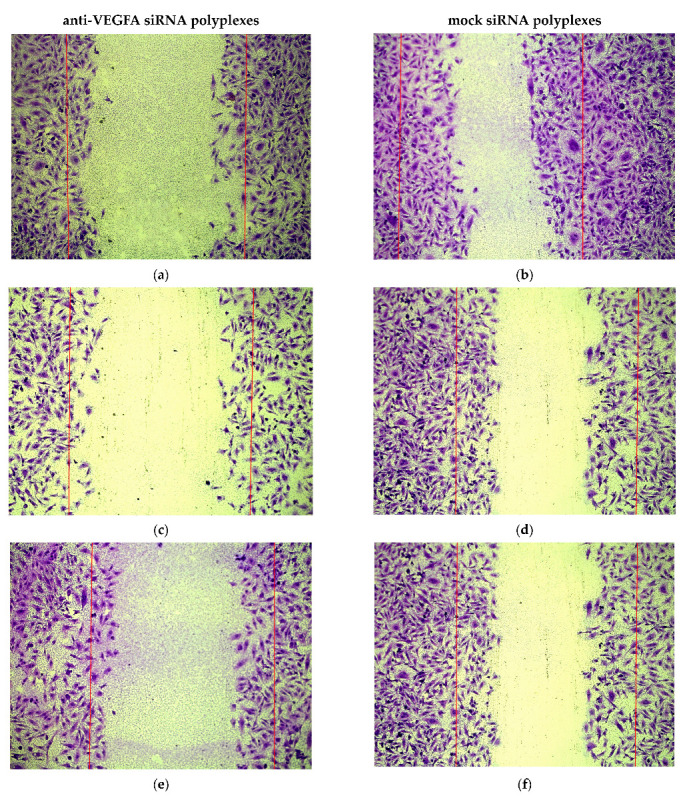
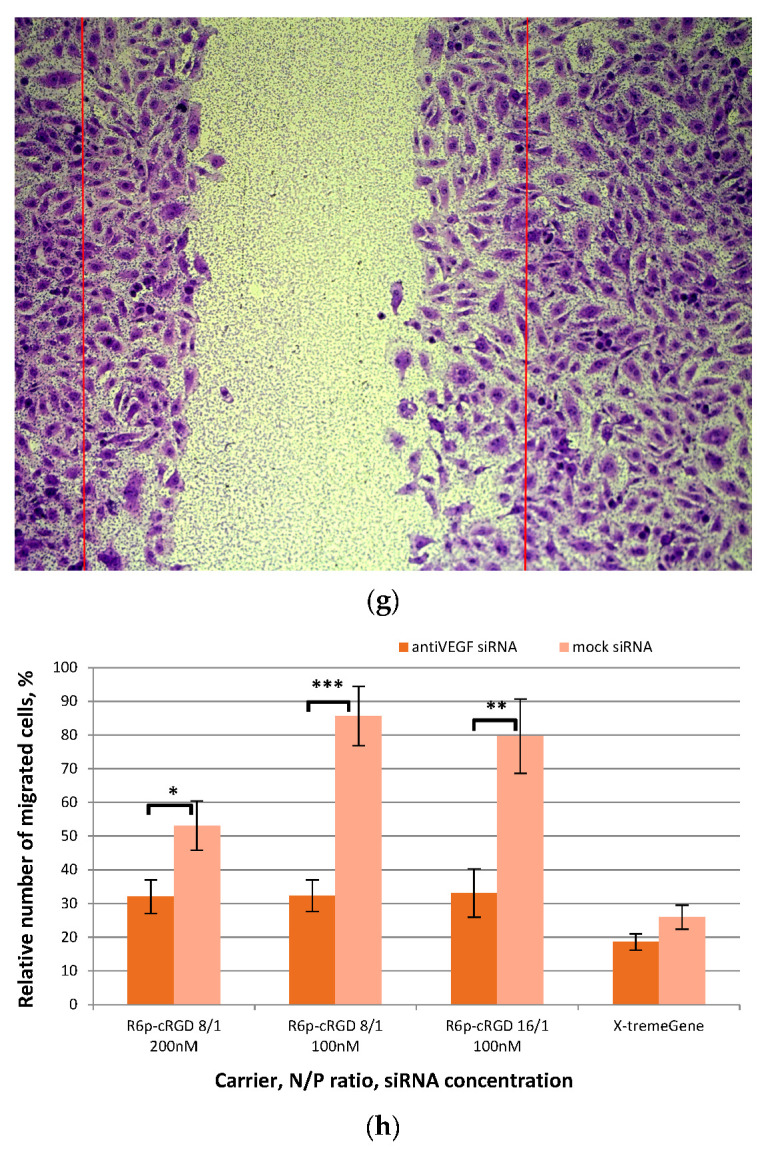
Visual appearance of migrated EA.Hy926 cells after treatment with (a) 100 nM of anti-VEGFA siRNA/R6p-cRGD at N/P ratio 8/1, (b) 100 nM of mock siRNA/R6p-cRGD at N/P ratio 8/1, (c) 200 nM of anti-VEGFA siRNA/R6p-cRGD at N/P ratio 8/1, (d) 200 nM of mock siRNA/R6p-cRGD at N/P ratio 16/1, (e) 100 nM of anti-VEGFA siRNA/R6p-cRGD at N/P ratio 16/1, (f) 100 nM of mock siRNA/R6p-cRGD at N/P ratio 16/1, (g) intact cells, (h) relative number of migrated EA.Hy926 cells after treatment with different concentrations of siRNA/R6p-cRGD polyplexes at N/P ratios 8/1 and 16/1. *—p < 0.05, **—p < 0.01, ***—p < 0.001 when compared with cells treated by mock siRNA-polyplexes. The data are shown as the mean ± S.D. of n = 15 individual samples from five independent experiments; statistical significance was assessed by ordinary one-way ANOVA.