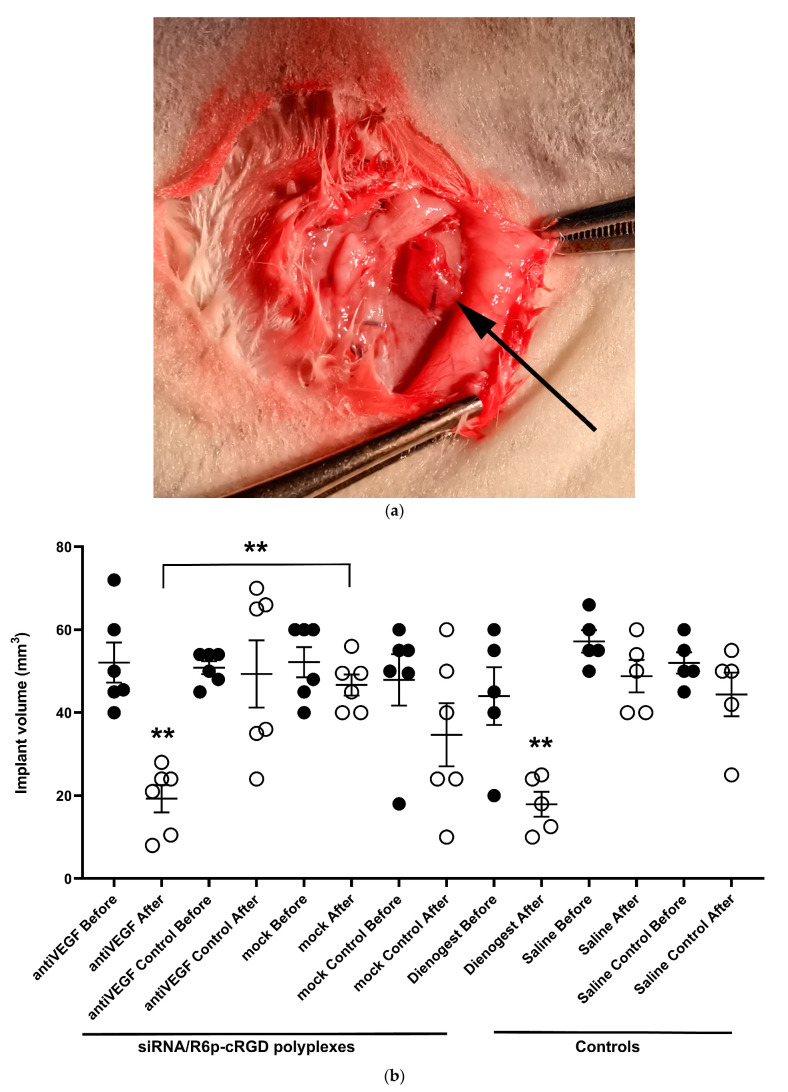
Figure 7.
Typical appearance of EM implant (a) before injection (indicated by arrow); volume of endometriotic implants (b) before and after the treatment with the anti-VEGFA or mock siRNA/R6p-cRGD polyplexes. White dots represent the values after the treatment, while black dots indicate the values prior to it. **—p < 0.01 when compared with implants before the treatment. The data are shown as the median ± interquartile range of n = 5–6 animals per experimental group; statistical significance was assessed by Kruskal-Wallis test.

