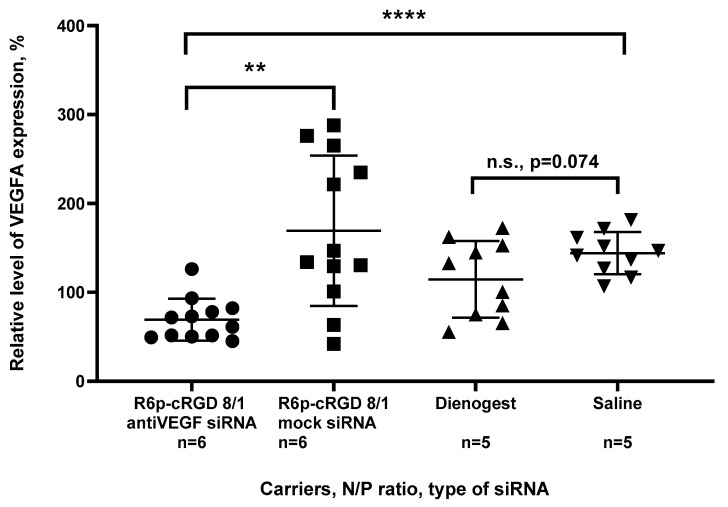
Figure 8.
Silencing of VEGFA gene expression in EM implants in vivo after treatment with the siRNA-complexes. The values are given relatively to intact implants. **—p < 0.01, ****—p < 0.0001 when compared with mock siRNA-polyplexes. The data are shown as the mean ± S.D. of n = 5–6 animals per experimental group and two independent measurements per animal; statistical significance was assessed by ordinary one-way ANOVA.

