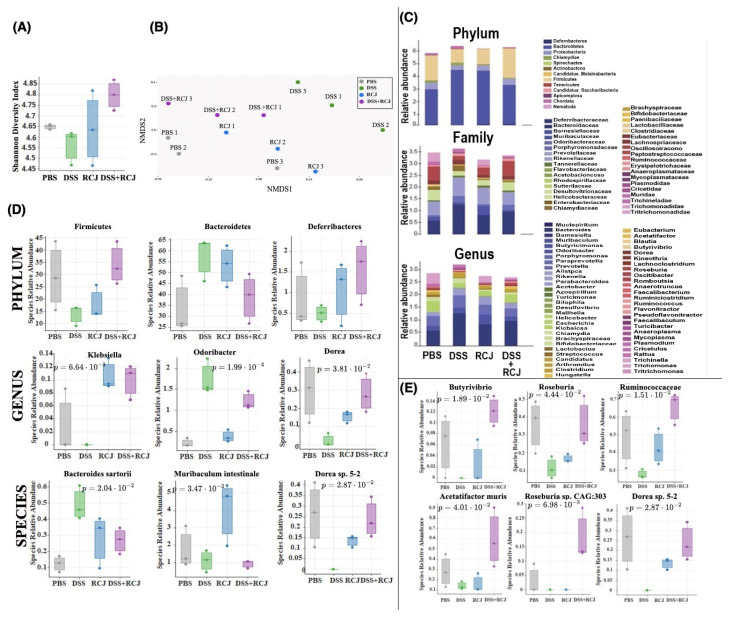
Figure 5.
Effect of RCJ treatment on gut microbiota. (A) Alpha diversity using Shannon indices, a measure of evenness in a sample. (B) NMDS plots representing the samples’ closeness when compared to the control. (C) Relative abundance of taxa. (D) Relative abundance of significant organisms at phylum, genus, and species level. (E) Relative abundance of some reported SCFA–producing taxa. Statistical significance was determined using one-way ANOVA, followed by the Tukey test.

