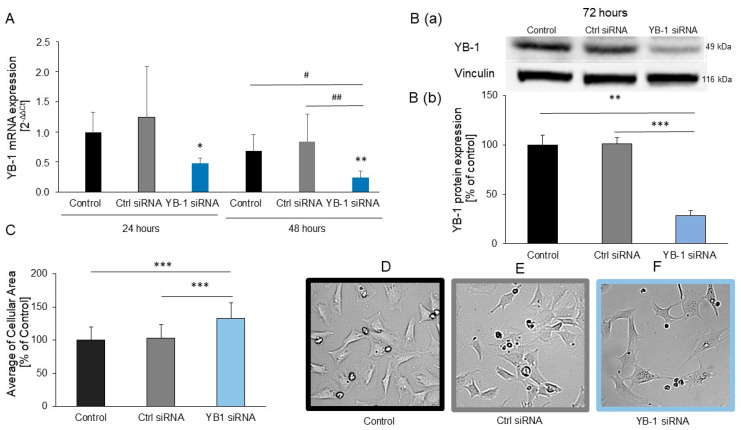
Figure 2.
YB-1 downregulation in H9C2 cells resulted in hypertrophic growth: H9C2 cells were transfected with YB-1 or Ctrl siRNA or were non-transfected. (A) Their mRNA levels were quantified after 24 h (n = 4) or 48 h (n = 8) with real-time qRT-PCR, using HPRT1 as the housekeeping gene. Data are presented as the means ± CIs. Key: * p < 0.05 versus control after 24 h; # p < 0.05, ## p < 0.01 comparison as indicated. YB-1’s protein levels were examined using Western blots (n = 4) after 72 h, using vinculin as the internal control. (B(a)) Representative Western blots. (B(b)) Quantitative analysis of YB-1 protein levels (n = 4). (C) Areas were measured for each cell 72 h after transfection with siRNA (n = 3 cell preparations, 18 dishes, with a total of 276–326 cells). (D–F) Representative images of H9C2 cells 72 h after transfection with siRNA. Data are presented as the means ± SEMs of unpaired two-tailed t-tests. Key: * p < 0.05, ** p < 0.01, *** p < 0.001.

