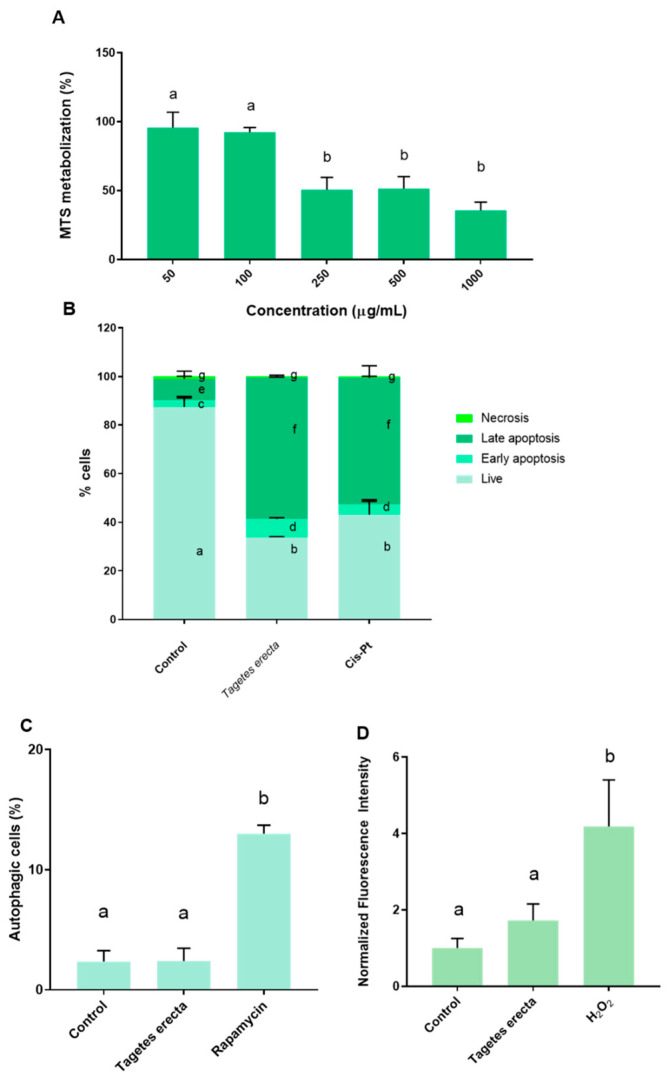
Figure 2.
Effect of 48 h exposition of ethanolic T. erecta extract. (A) Viability assay (MTS); (B) Apoptosis/necrosis measured by flow cytometry. IC50 of cis-Pt used as positive control; (C) ROS production. H2O2 25 µM used as positive control; (D) Autophagy induction. Rapamycin 0.5 µmol L−1 as positive control. Results are expressed as mean ± SD. For each parameter, different letters indicate statistically significant differences between groups (p < 0.05).

