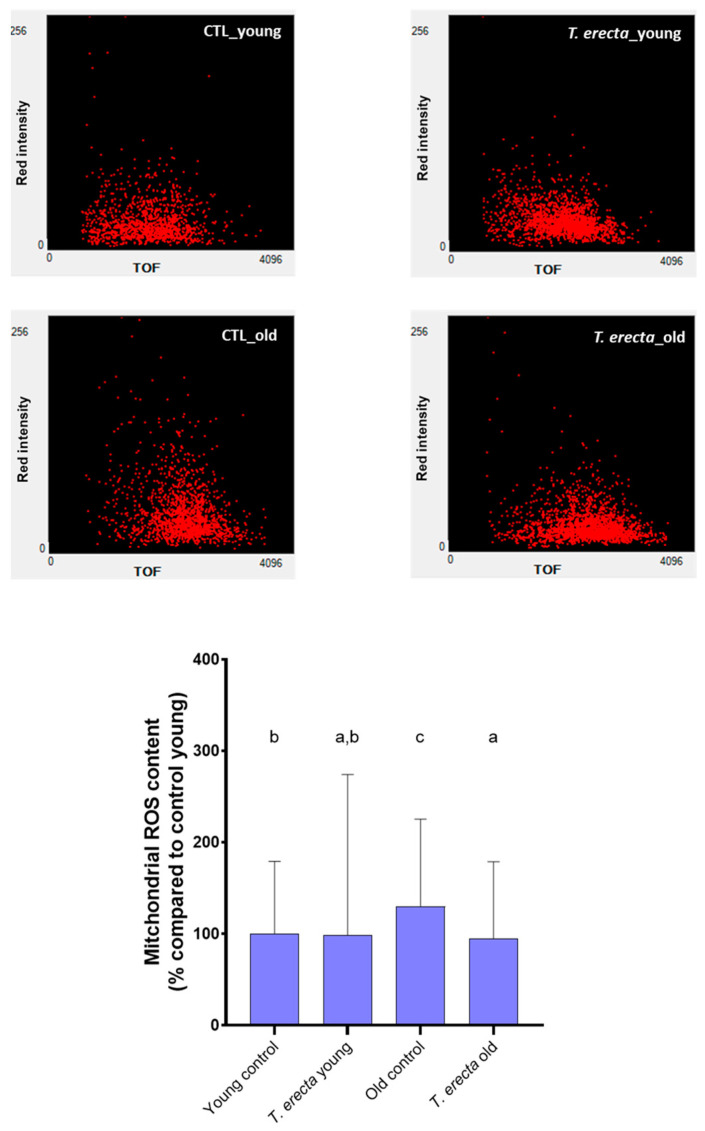
Figure 5.
Mitochondrial ROS content in Young and Old worms. Mitochondrial ROS content was measured by the Mitotracker Red CM-H2 XRos assay. L3 stage synchronized N2 nematodes were treated or untreated with 100 µg/mL T. erecta extract and incubated at 20 °C until the read-out point of the experiment (Young worms: 5 days old; Old worms: 12 days old). Representative images of Mitochondrial ROS quantification by Multi-Range Large Particle Flow Cytometer Biosorter (Union Biometrica, MA, USA) are shown above the bar charts (red fluorescence intensity vs. TOF: time of flight; worm size). Data are expressed as mean ± SD of three independent experiments (n = 3). Lower-case letters, when different, indicate statistically significant differences (p < 0.05). CTL_young: Young control (untreated worms); T. erecta_young: T. erecta treated worms (Young); CTL_old: Old control (untreated worms); T. erecta_old: T. erecta treated worms (Old).

