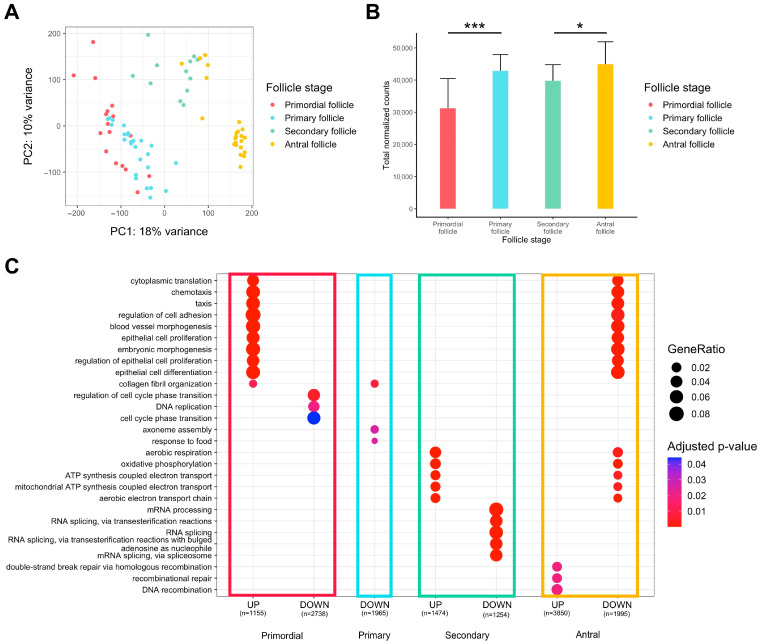
Figure 1.
Differential expression analysis of transcriptomic signature changes along the different stages of folliculogenesis (dataset from Zhang et al. (2018) [23]). (A) Principal component analysis of the whole expression dataset removing the 10% genes with the lowest variance. (B) Comparison of the normalized read counts total between the different follicle stages (significance assessed with a t-test, * p < 0.05, *** p < 0.005). (C) Comparative Gene Ontology enrichment analysis according to the up- or downregulation of transcripts between all four follicle stages. GeneRatio corresponds to the fraction of differentially expressed genes (DEGs) found in each Gene Ontology set.

