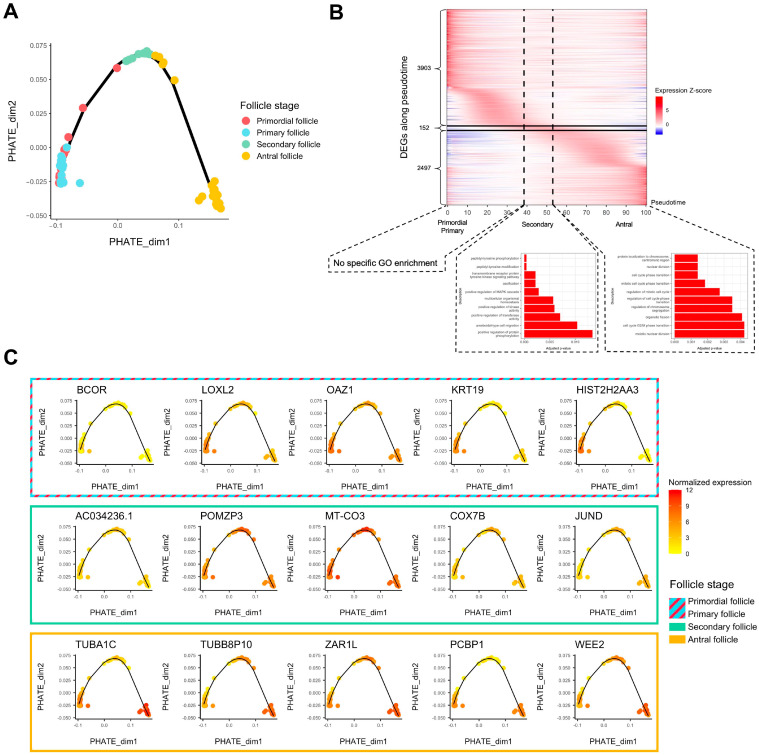
Figure 2.
Trajectory analysis of transcriptomic changes along folliculogenesis. (A) PHATE dimensionality reduction analysis of the whole expression dataset. (B) Heatmap of inferred expression of the most variable significant genes along folliculogenesis (6552 genes showing average expression changed by at least logFC > 1 within the oocyte developmental trajectory). Pseudotime is a metric that could be interpreted as a timing distance between one cell and its precursor cell and helps identify the ordering of cells along a lineage based on their gene expression profile. In this analysis, pseudotime 0 represents oocytes in the beginning of the window of the oocyte developmental trajectory (early follicles), while pseudotime 100 represents oocytes in the end of the window (antral follicles). Vertical lines delimit oocytes from the primordial/primary, secondary, and antral follicle groups. Horizontal lines delimit significantly differentially expressed genes along folliculogenesis reaching their peak expression during the primordial/primary (3903), secondary (152), and antral follicle groups (2497). (C) Variation of expression, for each follicle stage group, of the top 5 genes differentially expressed along folliculogenesis reaching their peak expression at this stage.

