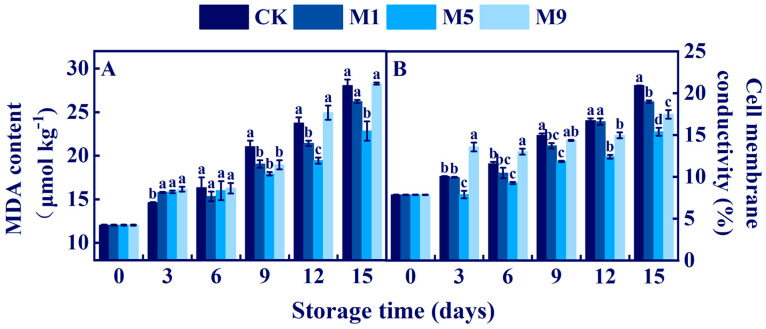
Figure 5.
Effects of Lp. plantarum NML21 treatments on the MDA (A) content and cell conductivity (B). CK represents the control (no treatment), and M1, M5, and M9 represent those sprayed once, five, and nine times, respectively, with NML21 standard solution. Bars represent standard error (±SE). Different letters represent significant differences within groups (p < 0.05).

