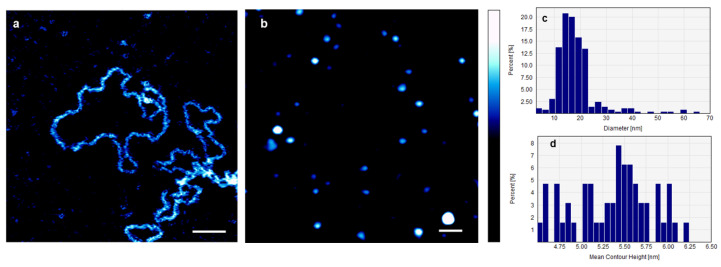
Figure 1.
(a) AFM image of individual DNA plasmids in 0.1× PBS containing 1 mM NiCl2 before the addition of AuNPs. Their average deconvoluted width and height were 4.2 ± 0.7 nm and 2.3 ± 0.5 nm, respectively. (b) AFM image of AuNPs on mica, in 0.1× PBS. The image shows individual uniformly distributed AuNPs. The average diameter of the AuNPs = 16.57 ± 3.74 nm, and their average contour height = 5.4 ± 0.7 nm. Aggregates of AuNPs are also visible in the image. (c,d) Illustration of the distributions of the average diameters and the average contour heights of AuNPs, respectively. Scale bar = 100 nm, and the color bar = 10 nm.

