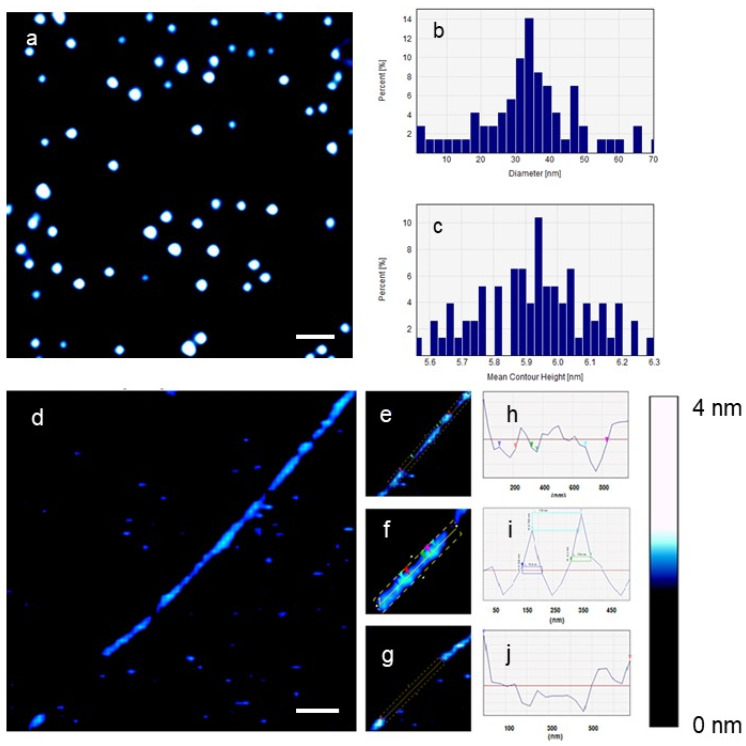
Figure 5.
The effect of LCAuNPs on a single DNA plasmid imaged on freshly cleaved mica in 0.1× PBS. (a) LCAuNPs, (b,c) the diameter and contour height of LCAuNPs, respectively, (d) the effect of LCAuNPs on a single DNA plasmid, (e–g) are different fragments of the DNA molecule depicted in (d), the dashed rectangle in (f) shows the interaction between a DNA fragment and two AuNPs, and (h–j) the average contour length and height of the labeled molecular fragments, respectively. The colored arrowheads in subfigures (h–j) correspond to those in subfigures (e–g), respectively. Scale bar = 300 nm.

