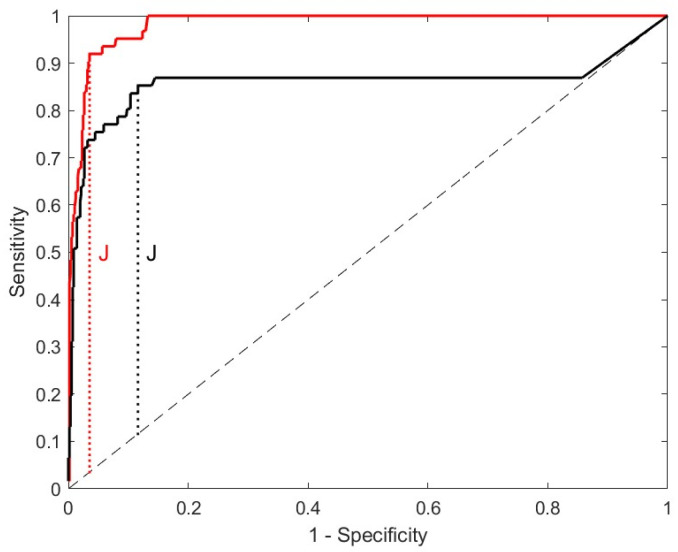
Figure 4.
ROC curve analyses to determine a cut-off value for CSF-CXCL13 for neuroborreliosis; CXCL13 values are given in pg/mL (red curve) and ng/g total protein (black curve). Two receiver operating characteristic (ROC) curve analyses were performed (black and red curve) for different units of CXCL13 to obtain the optimal cut-off value for CSF-CXCL13 to distinguish neuroborreliosis from all other neuroinfectious and autoimmune (inflammatory) diseases, as well as non-inflammatory controls, with the highest sensitivity and specificity. The red curve represents the ROC analysis for CSF-CXCL13, in pg/mL. The second ROC analysis was performed for CSF-CXCL13, given as ng/g total protein to compensate for protein elevations due to blood–CSF barrier dysfunction. The cut-off after optimization using Youden’s index (J; black dotted line) under the same conditions was 428.92 in pg/mL (red curve) and 164.15 in ng/g total protein (black curve), respectively.

