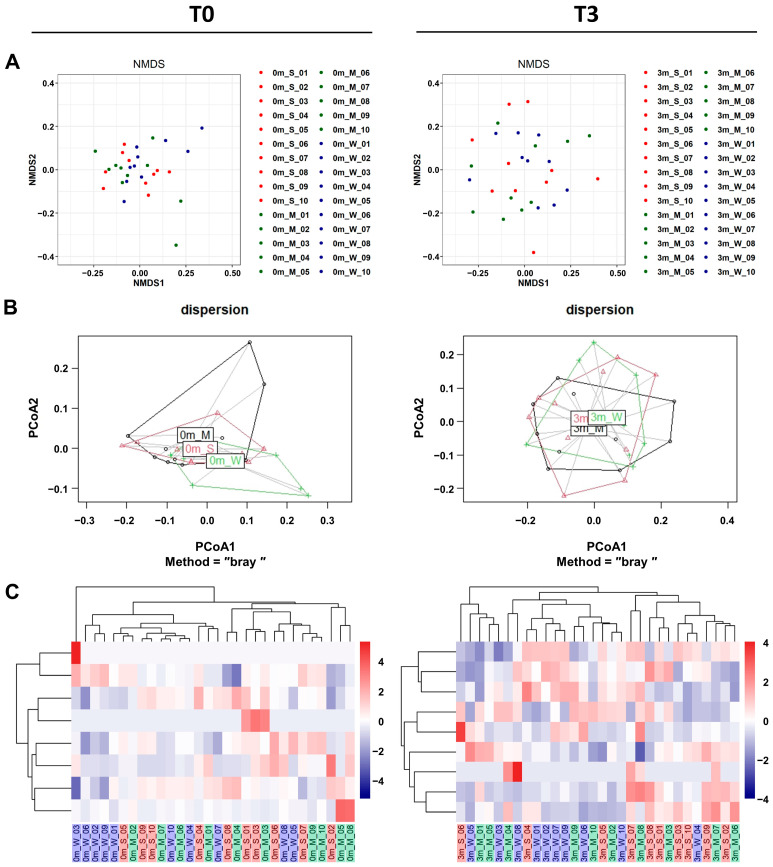
Figure 5.
The β-diversity comparison of the gut microbiome of the SMS, MMS, and WMS groups. (A) Non-metric multidimensional scaling (NMDS) plots are shown, depicting the differences in the gut microbiome before (T0, left) and after (T3, right) FMT in the SMS, MMS, and WMS groups, based on Bray–Curtis distances calculated using operational taxonomic units (OTUs). (B) Principal coordinates analysis (PCoA) based on the Bray–Curtis distance from the PERMANOVA analysis (betadisper function) in the gut microbiome before (T0, left) and after (T3, right) FMT in the SMS, MMS, and WMS groups. (C) Heatmaps of the microbial composition of the SMS, MMS, and WMS groups before (T0, left) and after (T3, right) FMT are shown, based on the Bray–Curtis distance matrix measured at the phylum level. S, M, and W represent the SMS group, MMS group, and WMS group, respectively.

