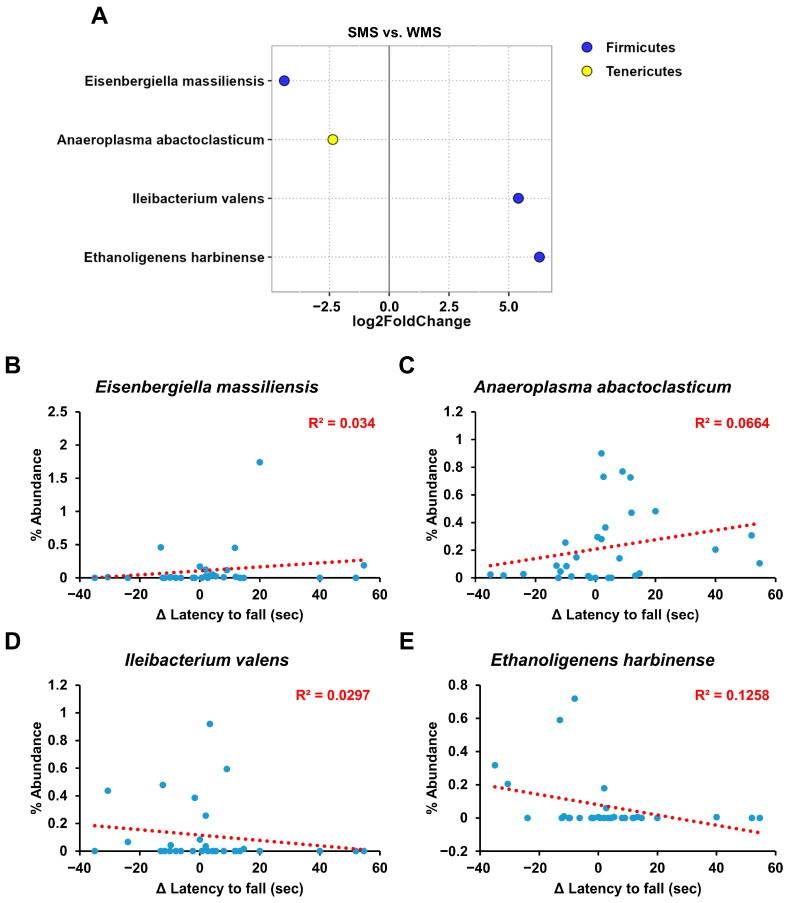
Figure 7.
The key taxa changes between SMS and WMS via differential abundance analysis. (A) The log2-fold change in abundance of the most abundant species in the gut microbiome of the SMS and WMS groups was analyzed using DESeq2 differential abundance analysis. Each point represents a comparison of species between the two experimental groups. (B–E) The normalized abundances of four significantly different bacterial species of interest that were identified from the differential abundance analyses are shown. Scatter plots represent the % abundances of each individual species.

