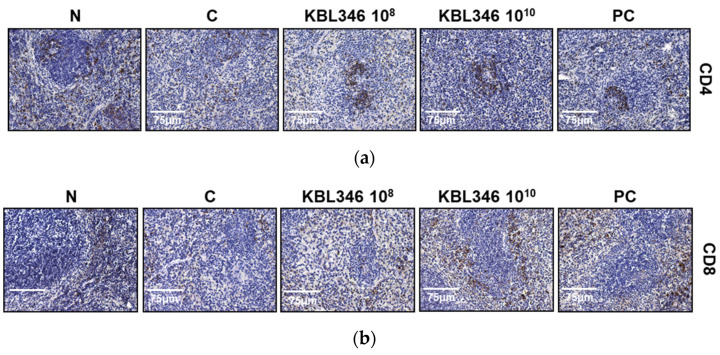
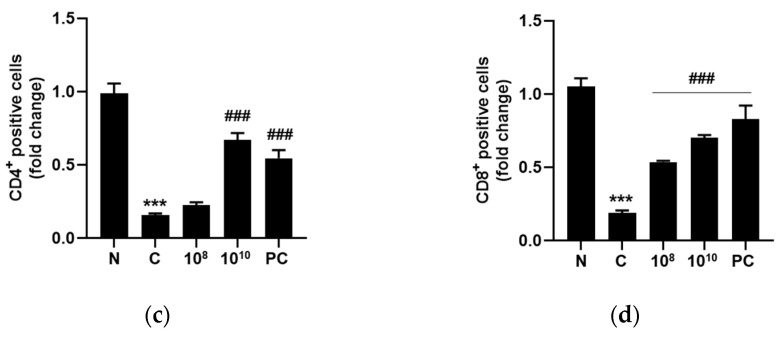
Figure 9.
Restoration of CD4- and CD8-positive T lymphocytes in the spleen of CPA-induced immunosuppressed mice. (a,b) Representative immunohistochemical staining images and (c,d) fold changes of CD4+ and CD8+ cells in CPA-treated mouse spleen. Scale bar: 75 μm. N, naïve mouse; C, CPA (100 mg/kg)-treated mouse; 108, CPA-treated mouse administered with 108 CFU/kg of KBL346; 1010, CPA-treated mouse administered with 1010 CFU/kg of KBL346; PC, positive control group administered with red ginseng (100 mg/kg). * Significant difference compared with the naïve group (*** p < 0.001). # Significant difference compared with the CPA-treated control group (### p < 0.001).


