Figure 1.
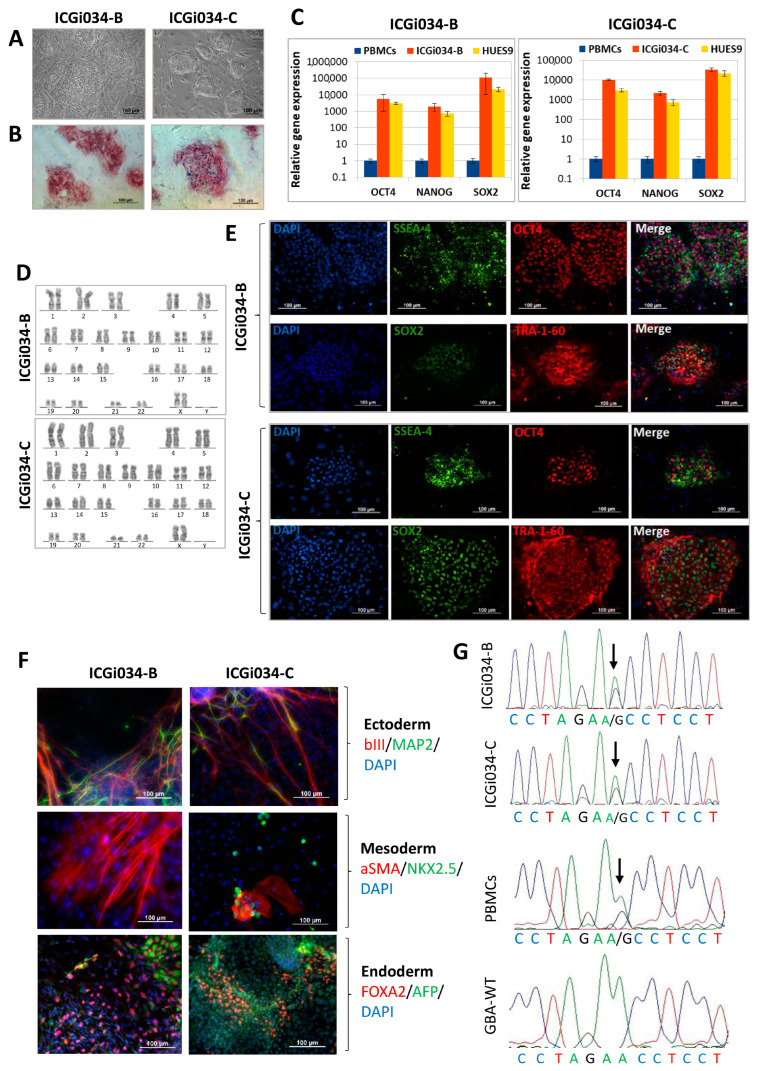
Characterization of the induced pluripotent stem cells (iPSC) cell lines ICGi034-B and ICGi034-C: (A) Morphology of iPSC colonies. (B) Quantitative analysis of the expression of pluripotency markers (NANOG, OCT4, SOX2) using RT-qPCR. Error bars show standard deviation. (C) Histochemical detection of alkaline phosphatase. (D) Karyotype analysis (G-banding) (46,XX). (E) Immunofluorescent staining for pluripotency markers OCT4, SOX2, SSEA-4, TRA-1-60. (F) Immunofluorescent staining for differentiation markers: αSMA (red signal) and NKX2.5 (green signal) (mesoderm); TUBB3 (red signal) and MAP2 (green signal) (ectoderm); FOXA2 (red signal) and AFP (green signal) (endoderm). Nuclei are stained with DAPI (blue signal). (G) Sequence images of the GBA1 gene regions vof the patient’s peripheral blood mononuclear cells (PBMCs), iPSC lines ICGi034-B and ICGi034-C, and a healthy donor (GBA-WT). Identified polymorphisms are marked with arrows. All scale bars—100 μm.

